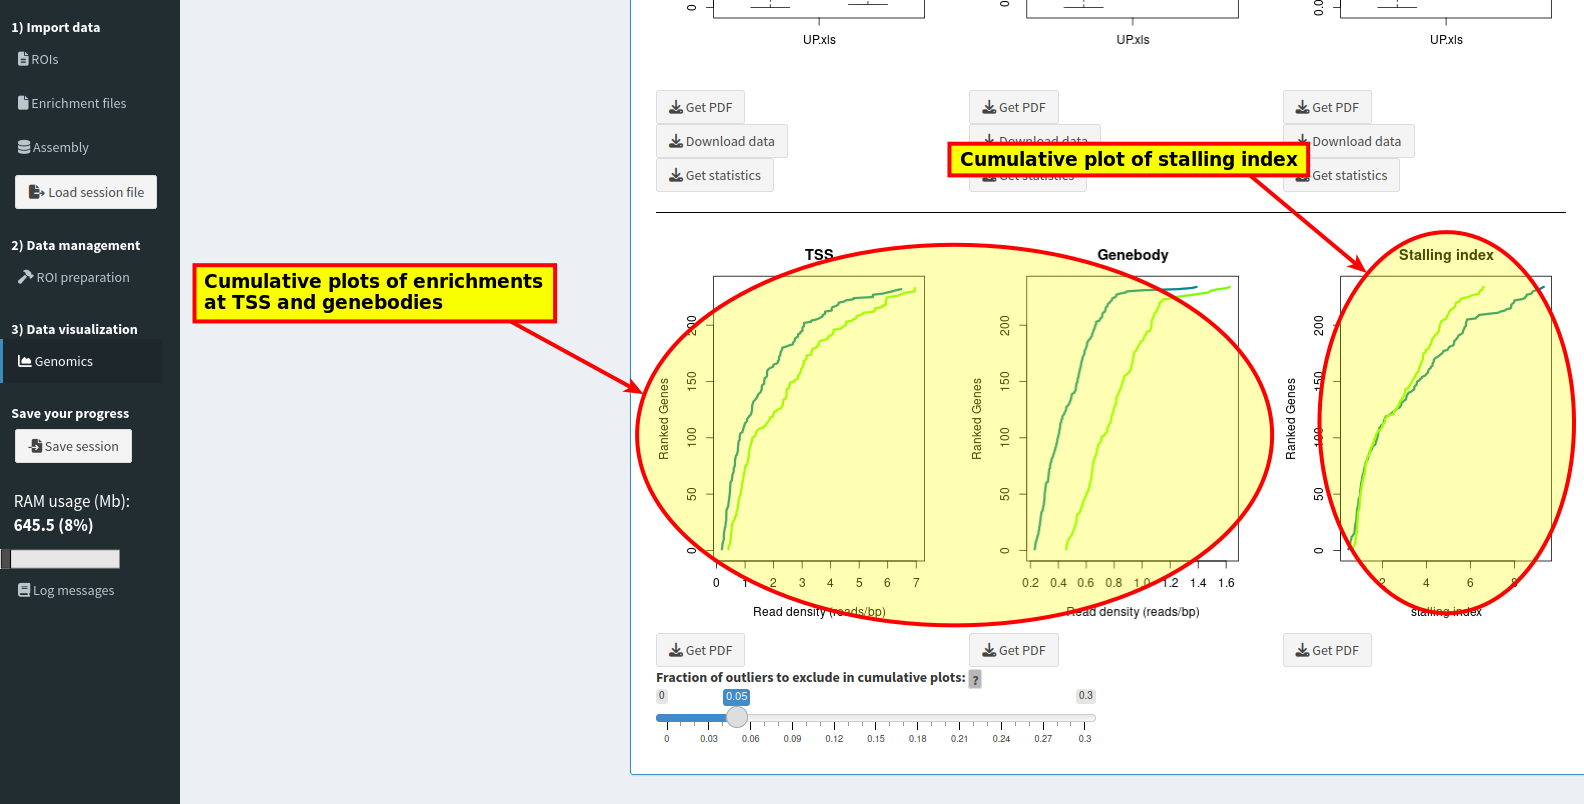
Three kind of files can be imported in ChroKit:
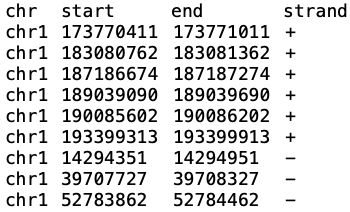
Select the file from filesystem (for an example, load YAP_peaks.xls from the ChroKit-master/source/appContent/tutorial_files/ directory. NOTE: if you are running ChroKit using Docker, you will find all the computer files in the folder you chose for mounting, should be the /mnt folder):
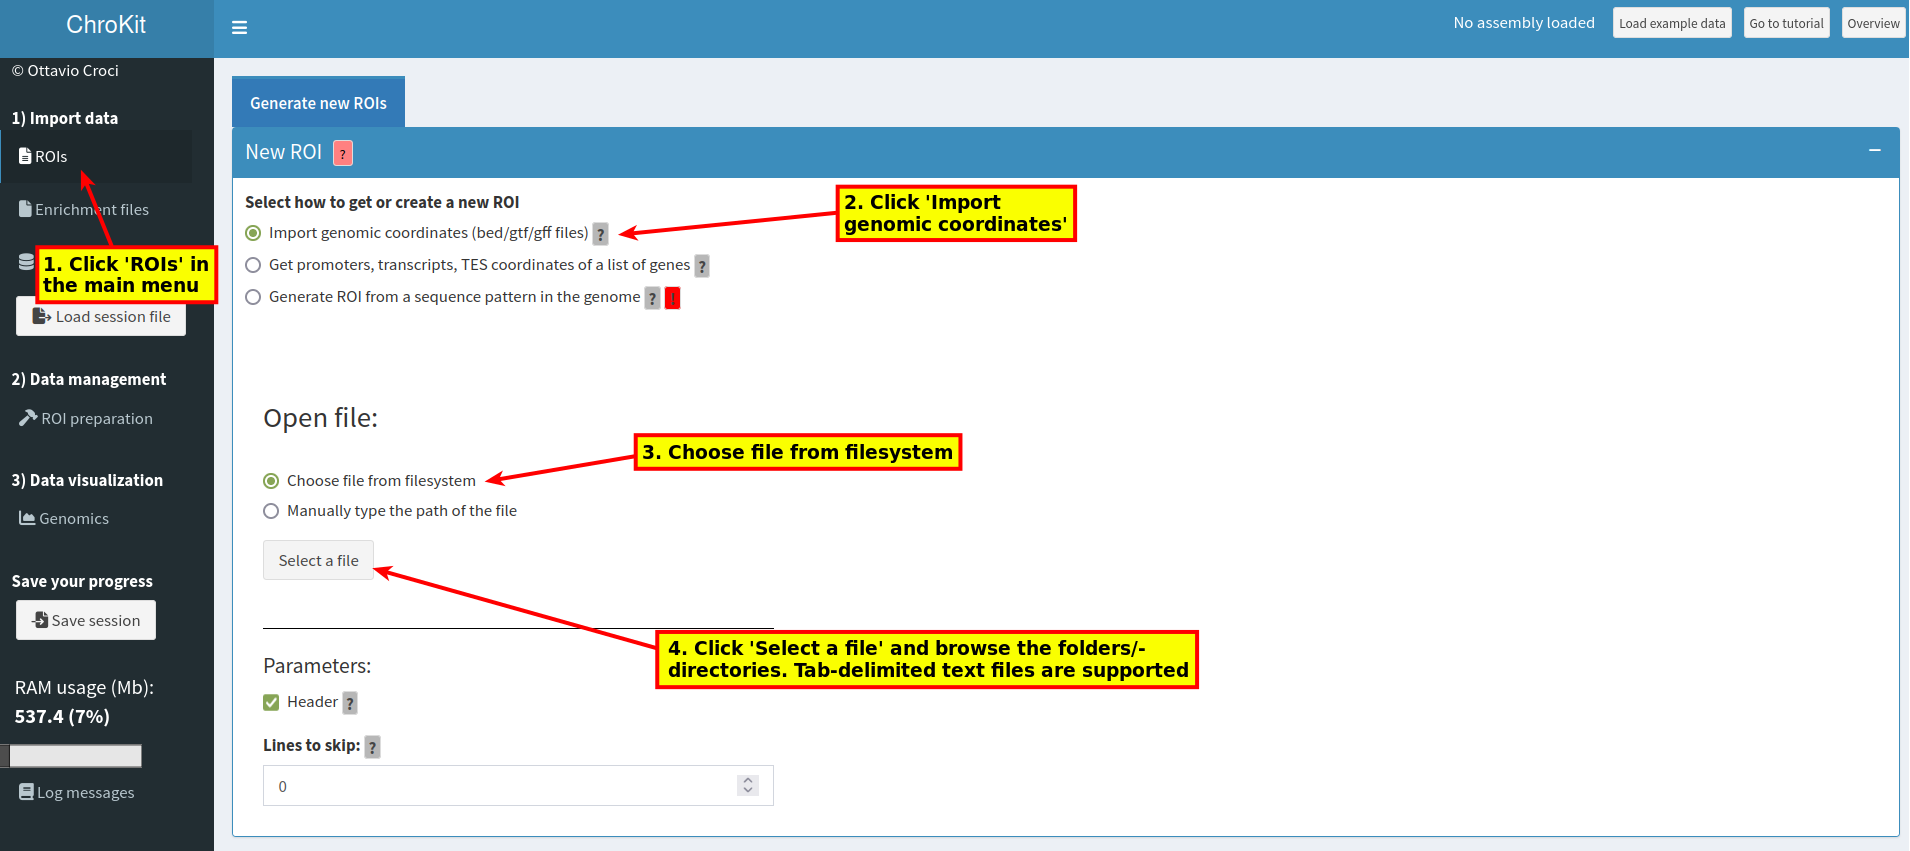
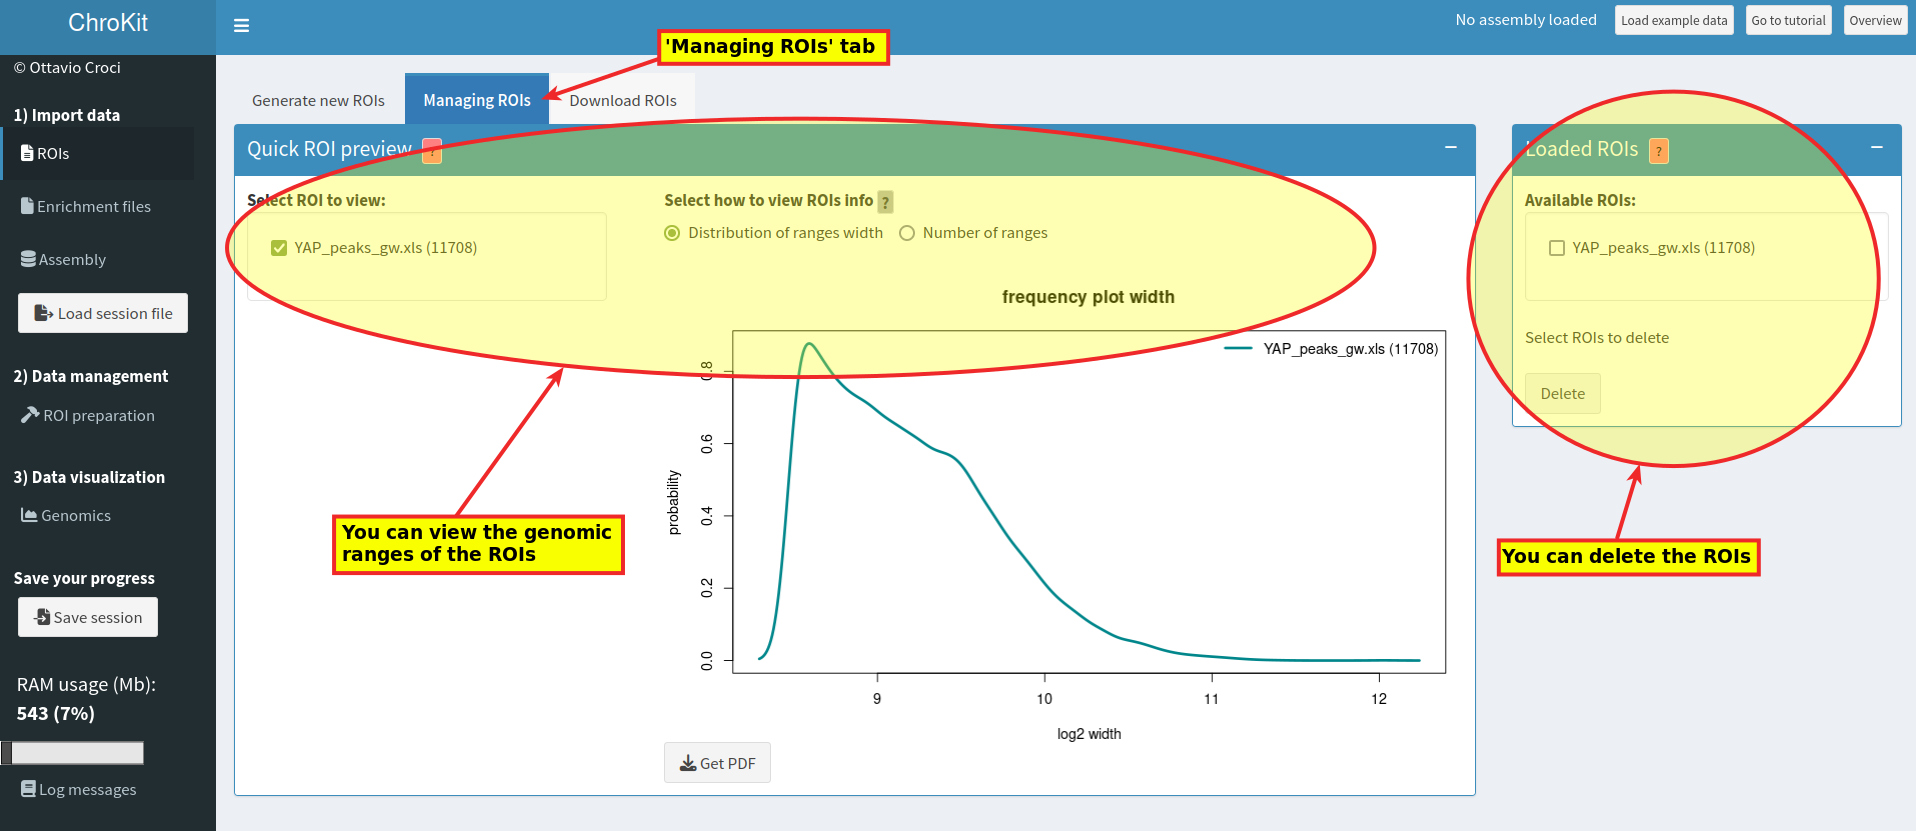
Preview the file and then confirm the import:
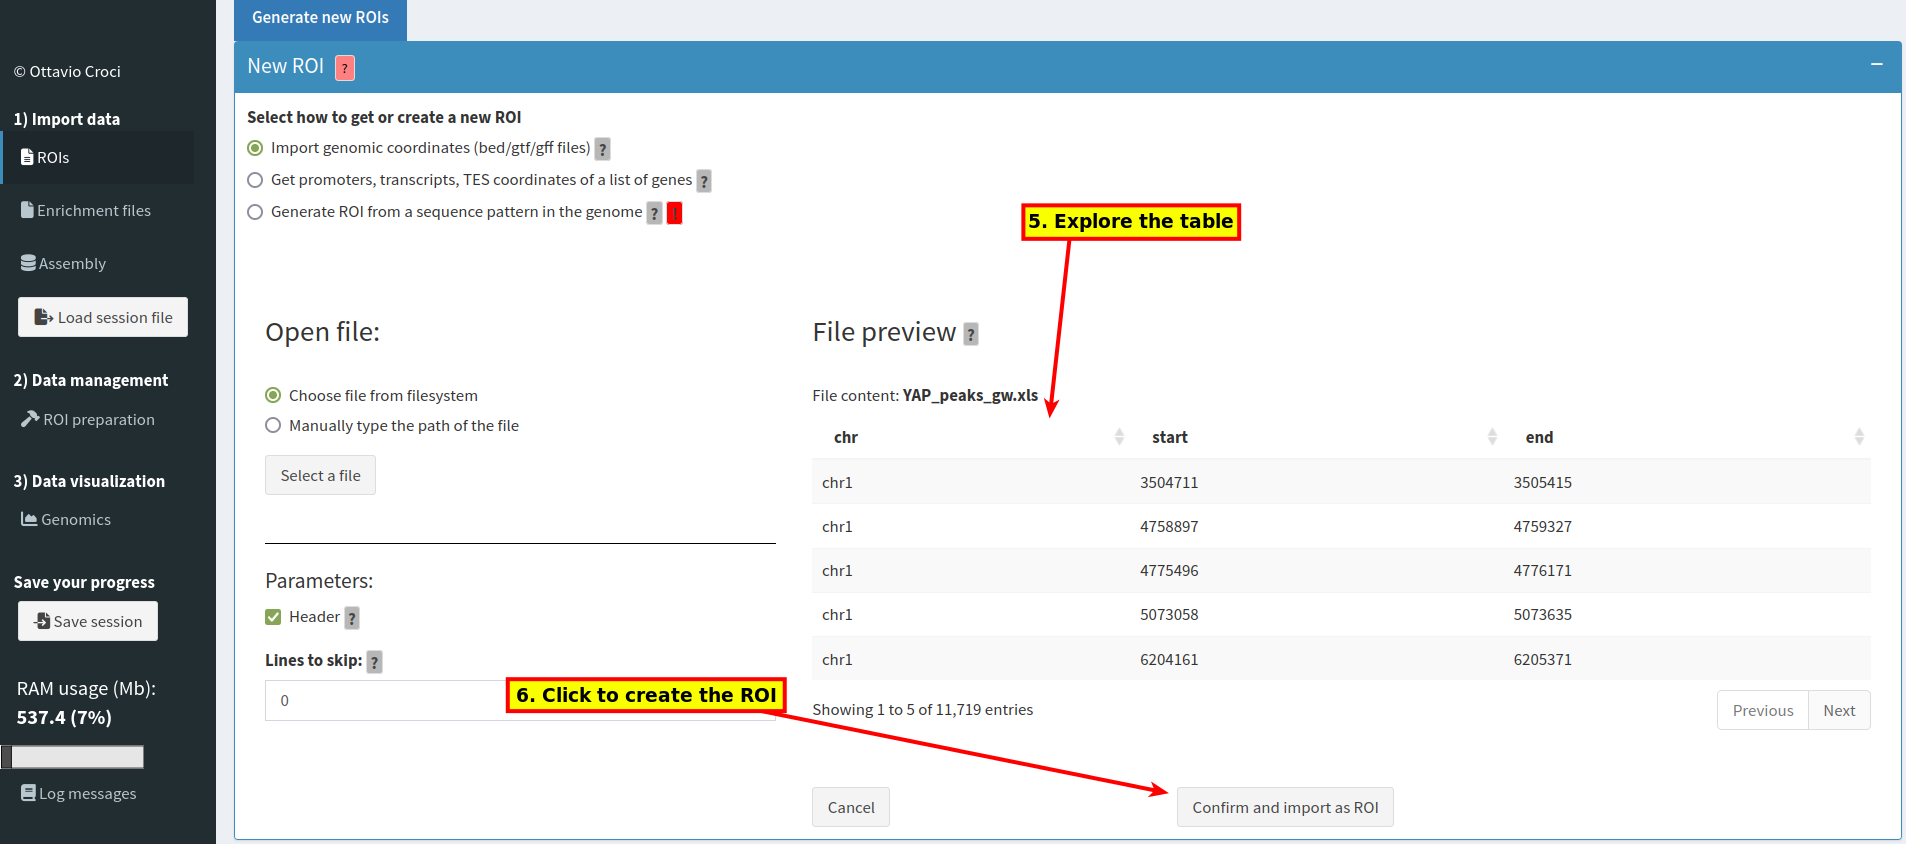
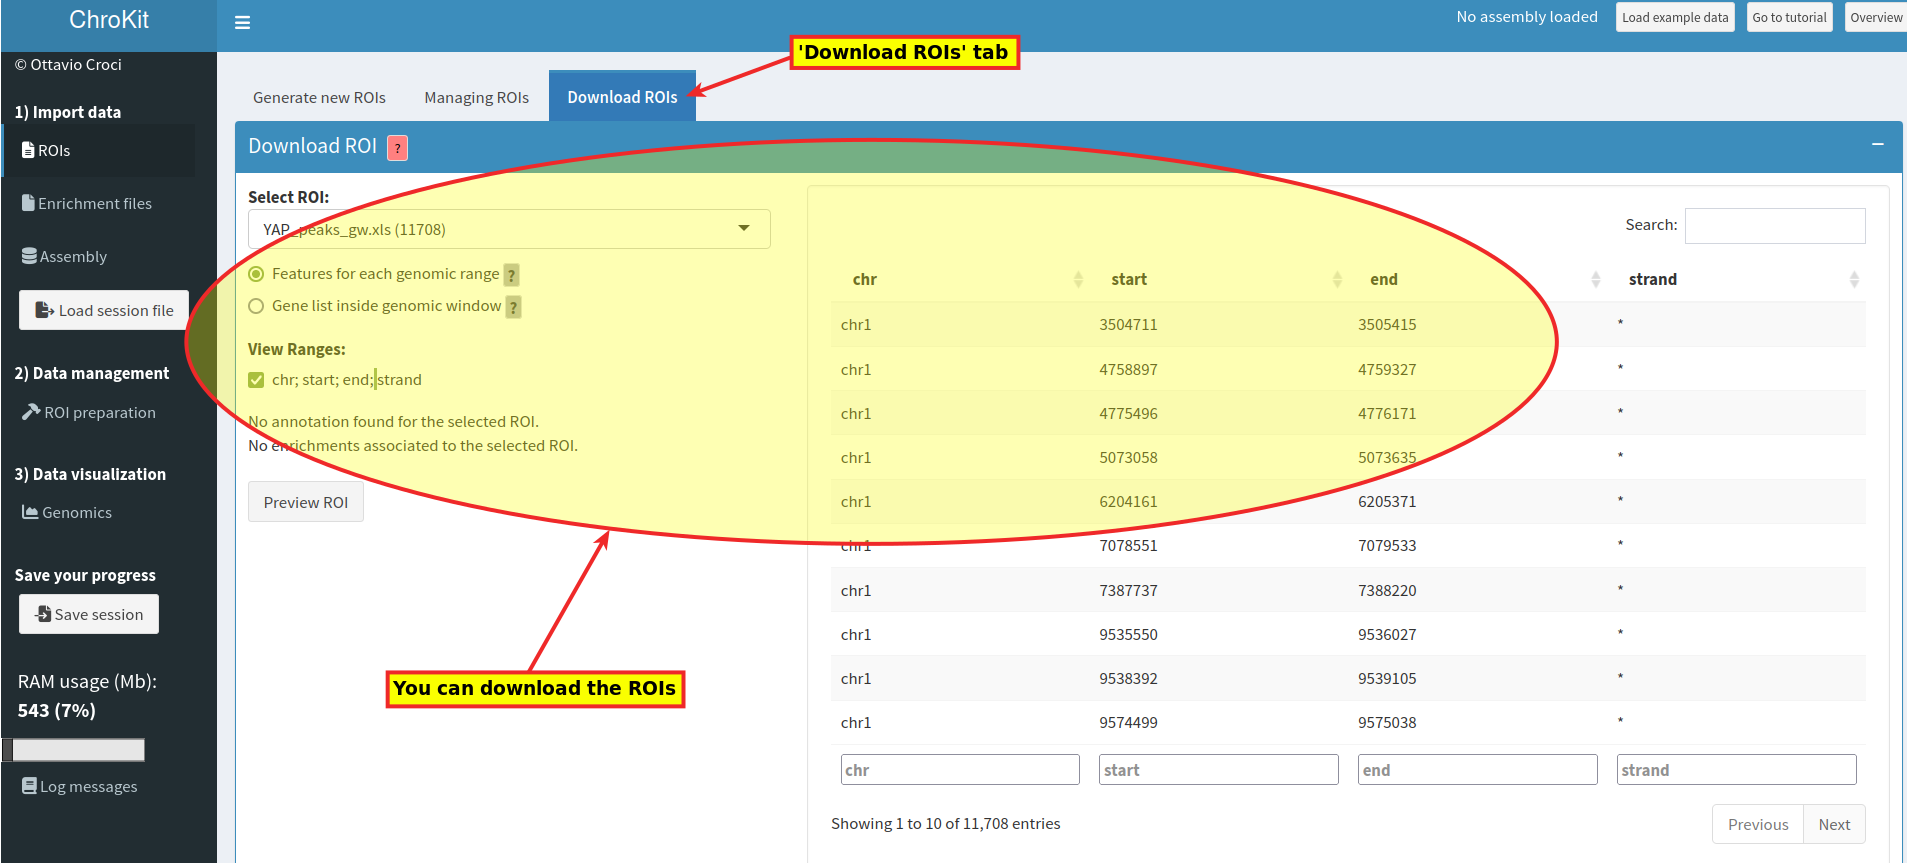
After importing the ROI, new menus and functions will be available in two additional tabs:
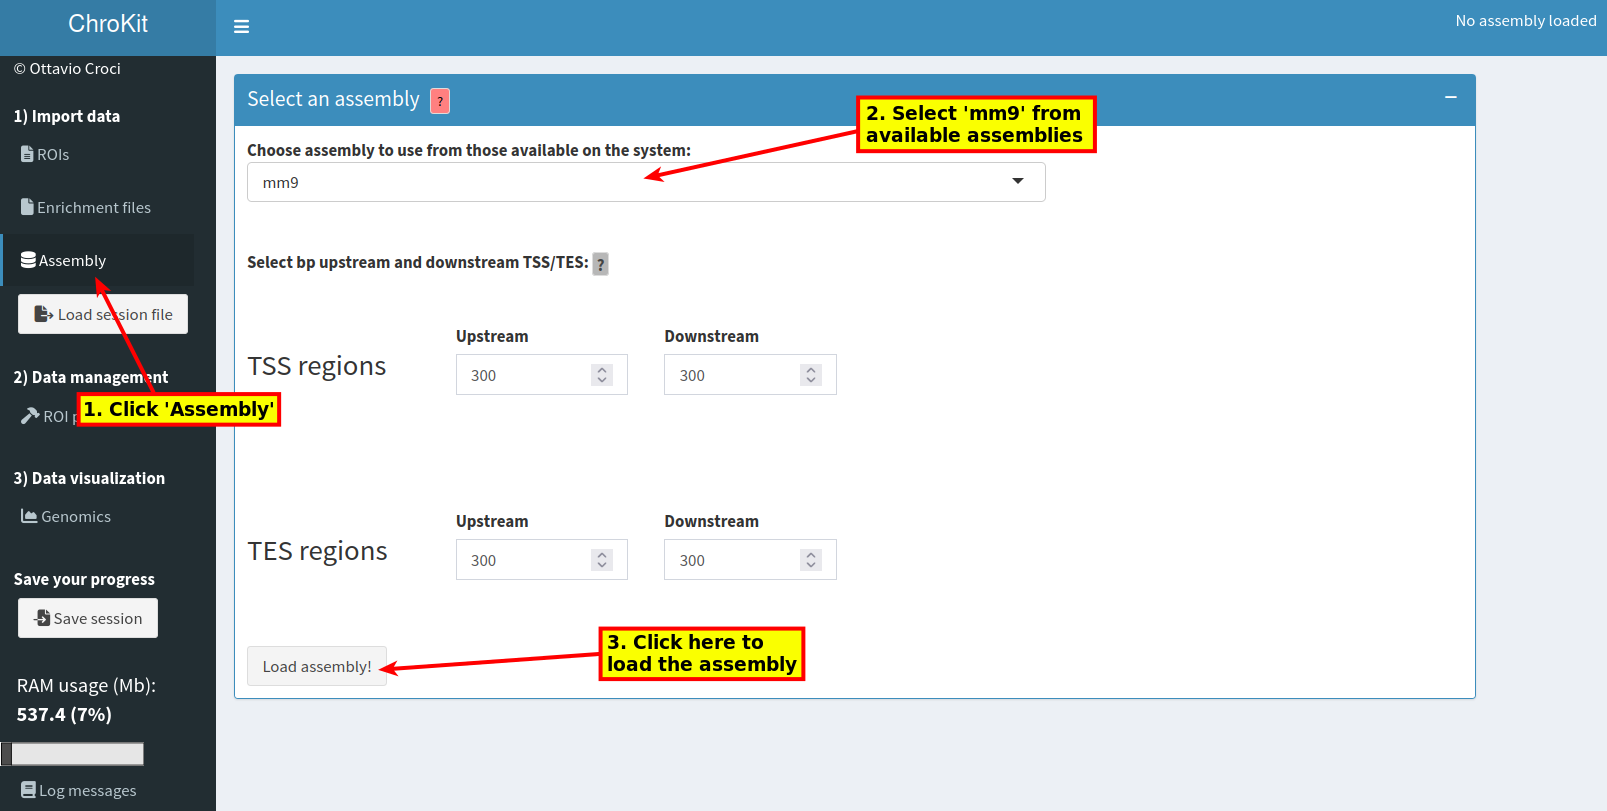
Import a genome assembly (here mm9) to obtain the coordinates of annotated genomic elements:
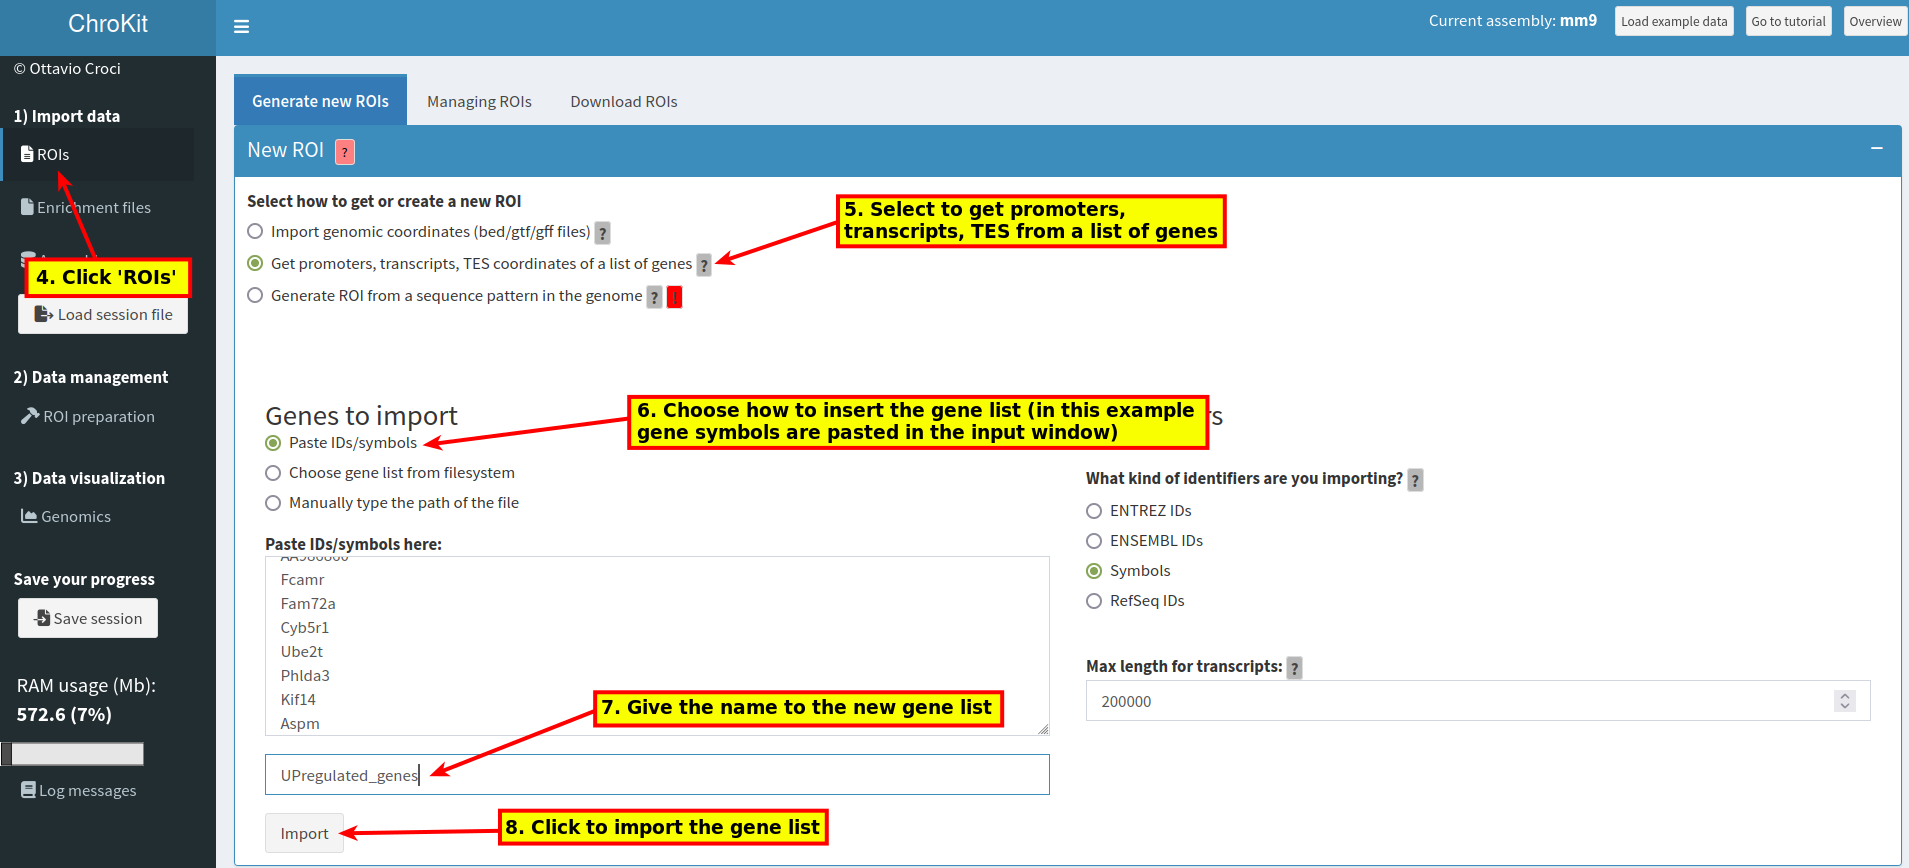
Import the genelist:
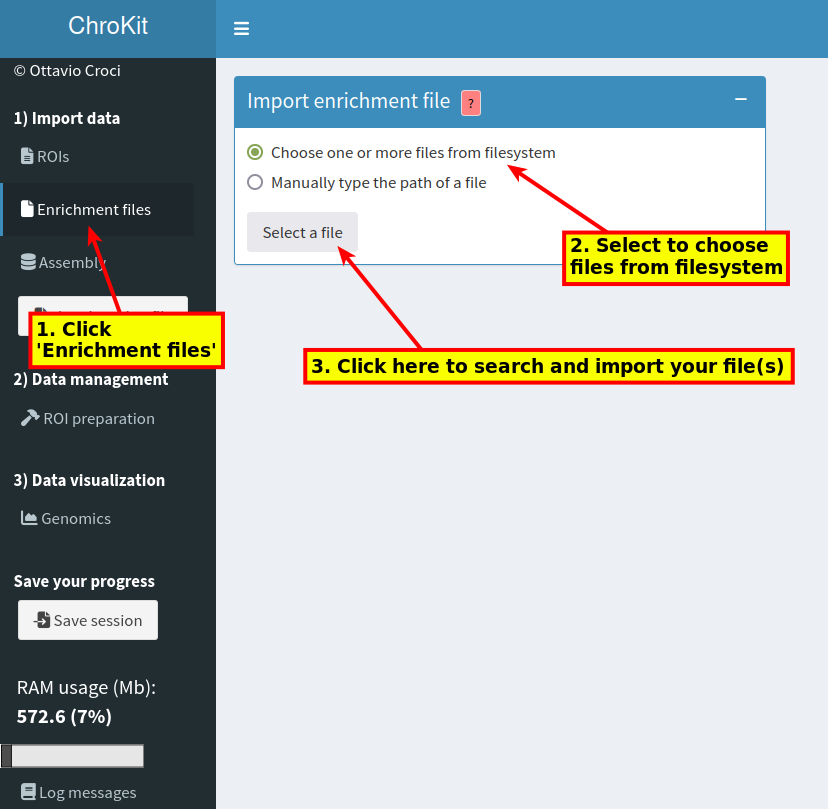
Select the enrichment file(s) to be imported (formats supported: bam or bigWig*. NOTE: if you are running ChroKit using Docker, you will find all the computer files in the folder you chose for mounting, should be the /mnt folder):
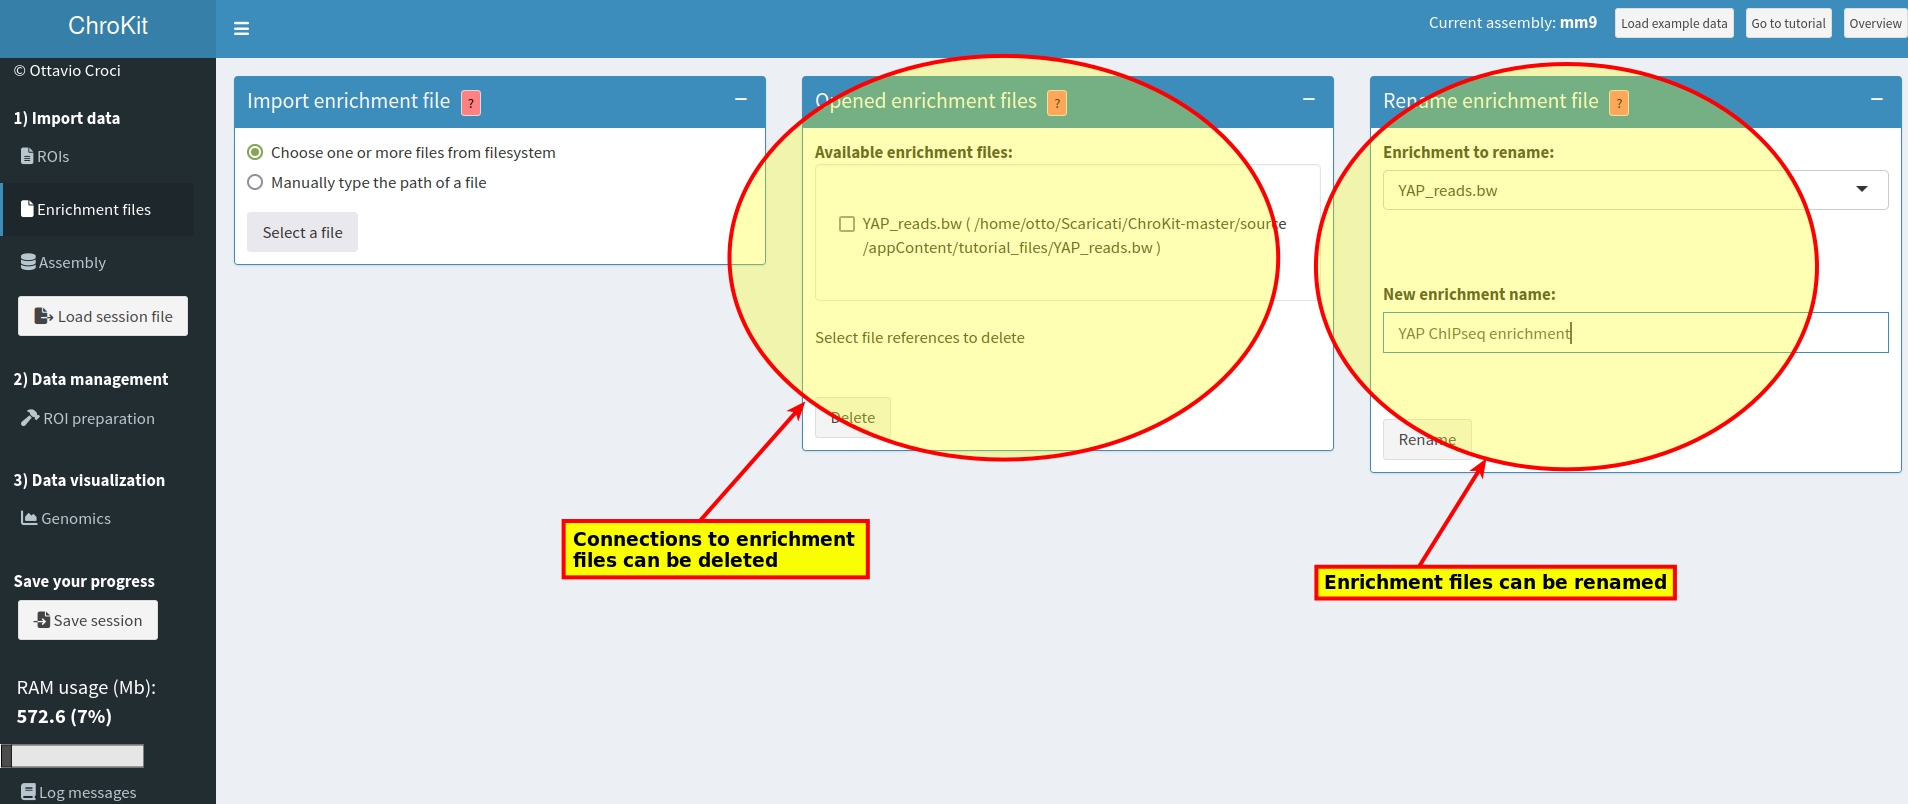
Once imported, a file can be renamed or removed:
Option 1: With the example data
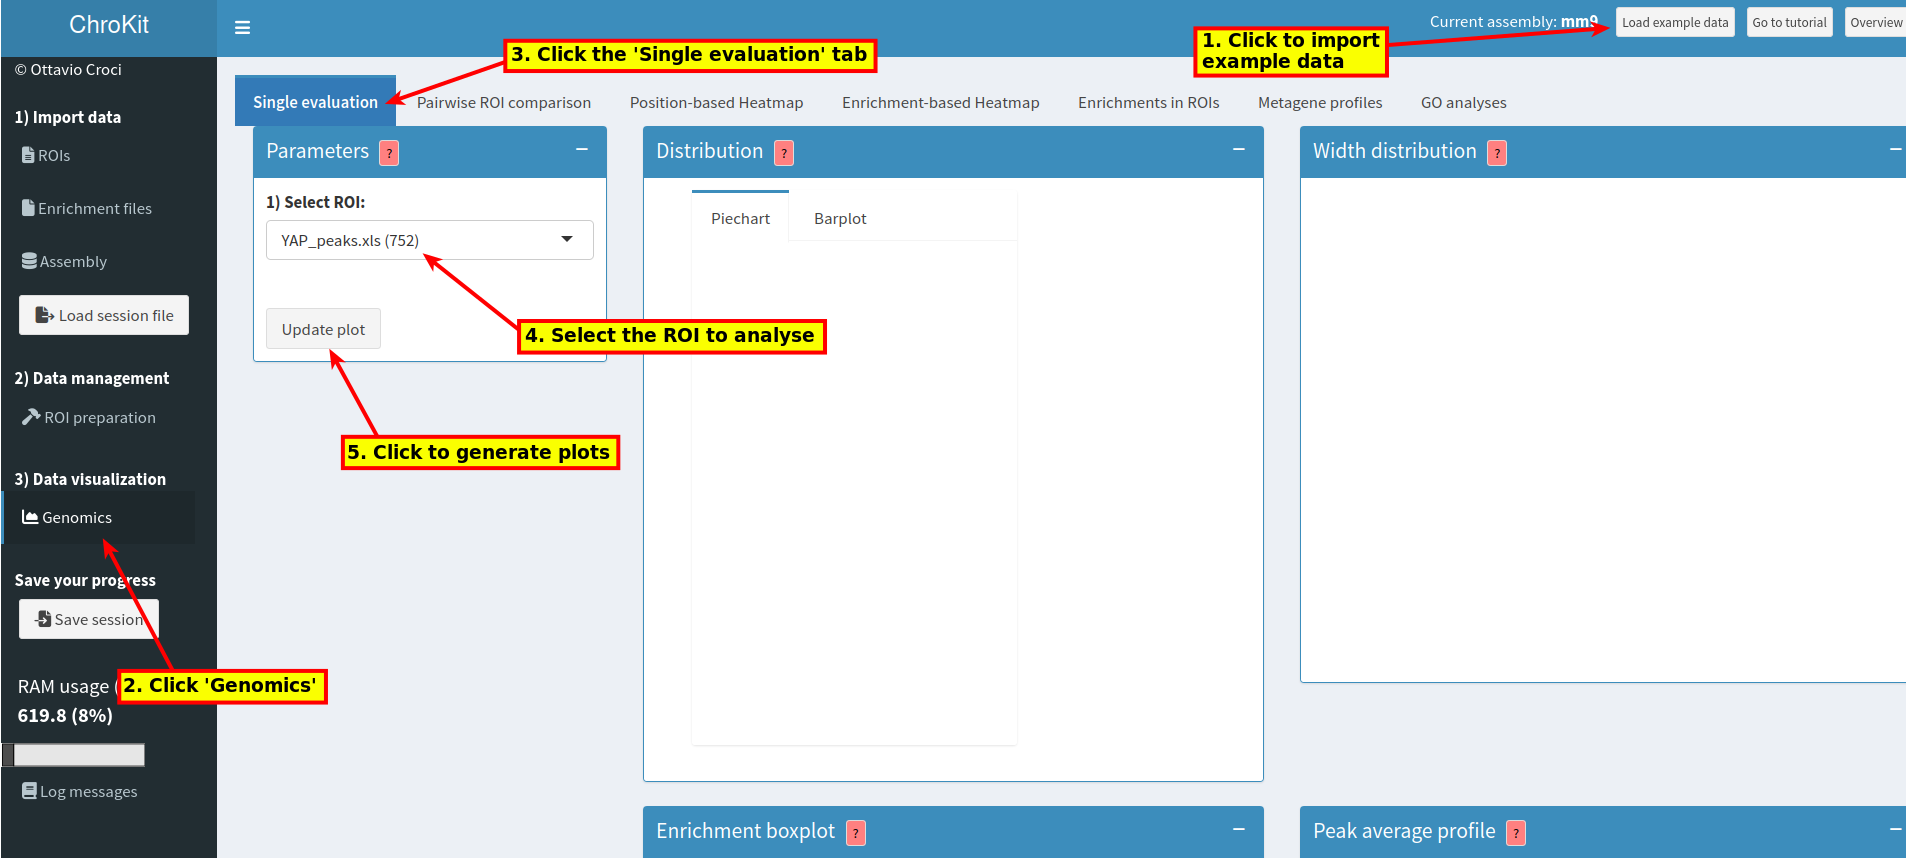
Load the example data (1), click 'Genomics' (2) and select the single evaluation analysis (3)
Option 2: With your own data
Alternatively, if you have your own ROIs, start from step 2 and select the ROI that you want to analyze in the step 4
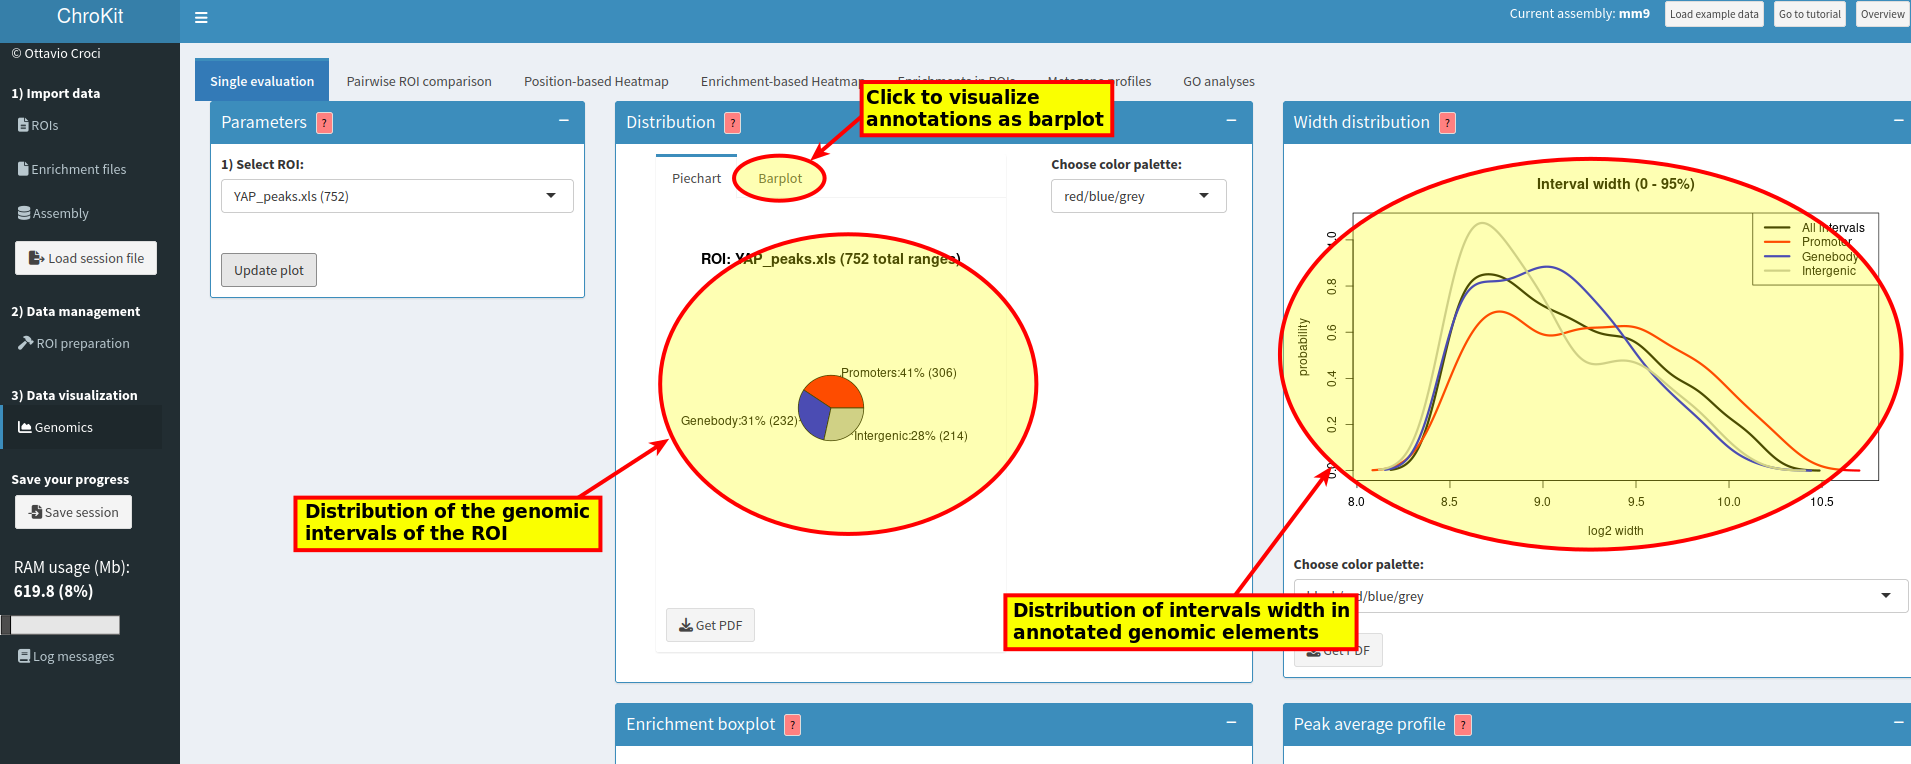
Then look and the plots, adjust their graphical options or download them:
Option 1: With the example data
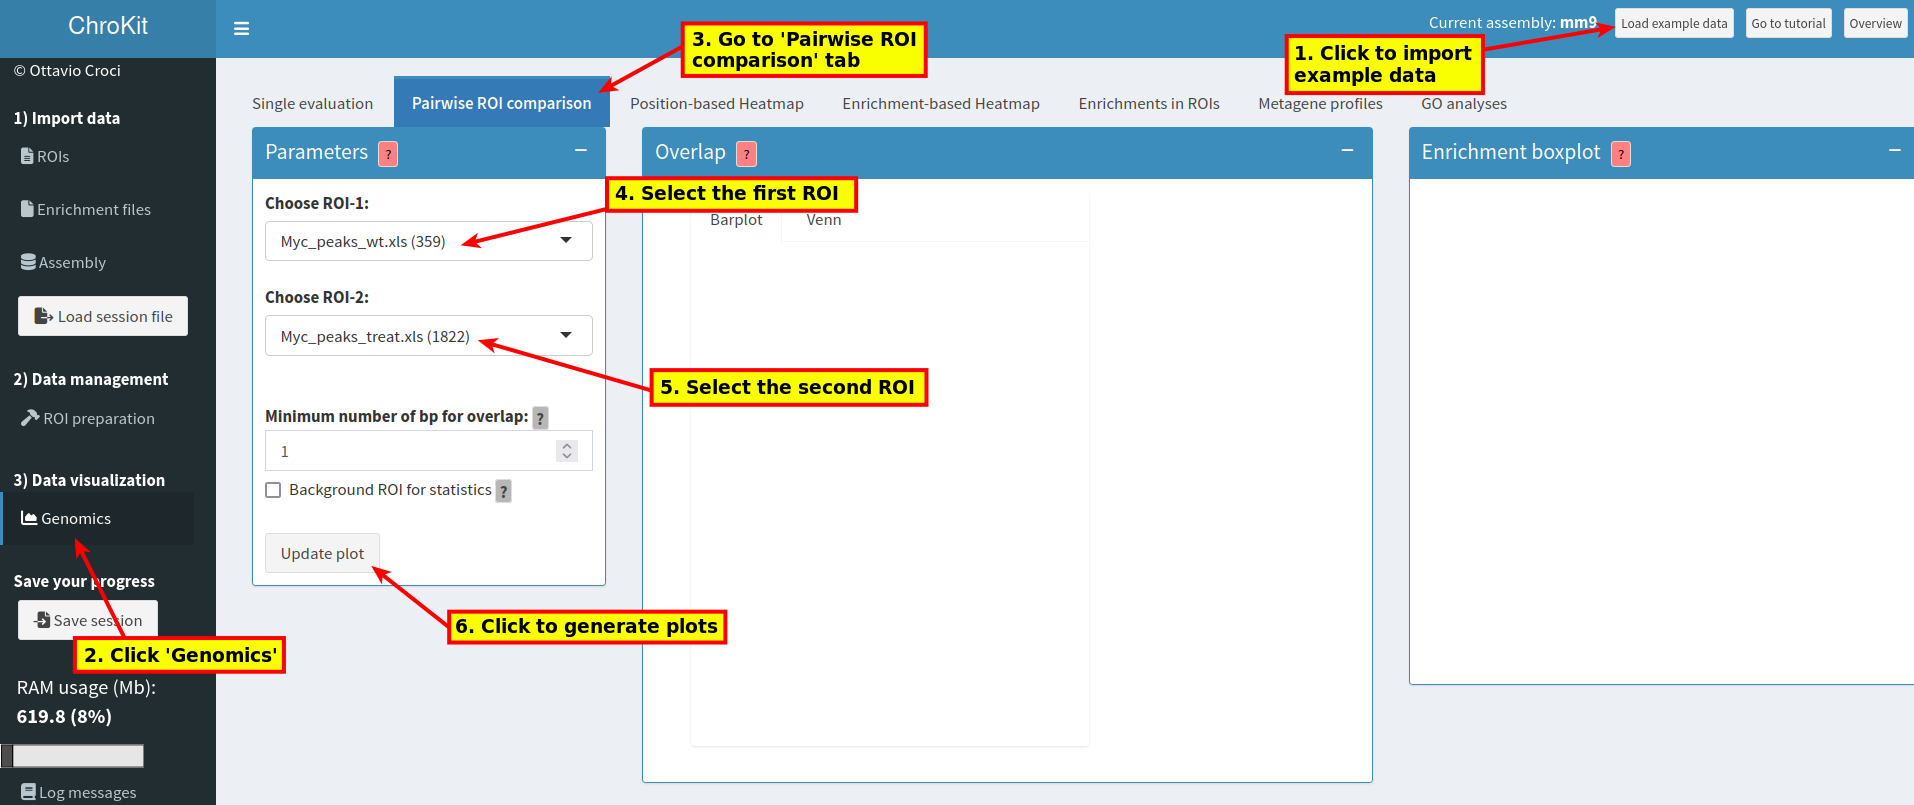
Load the example data (1), click 'Genomics' (2) and select the pairwise ROI comparison tab (3).
Option 2: With your own data
Alternatively, if you have your own ROIs, start from step 2 and select the ROIs that you want to analyze (step 4, 5):
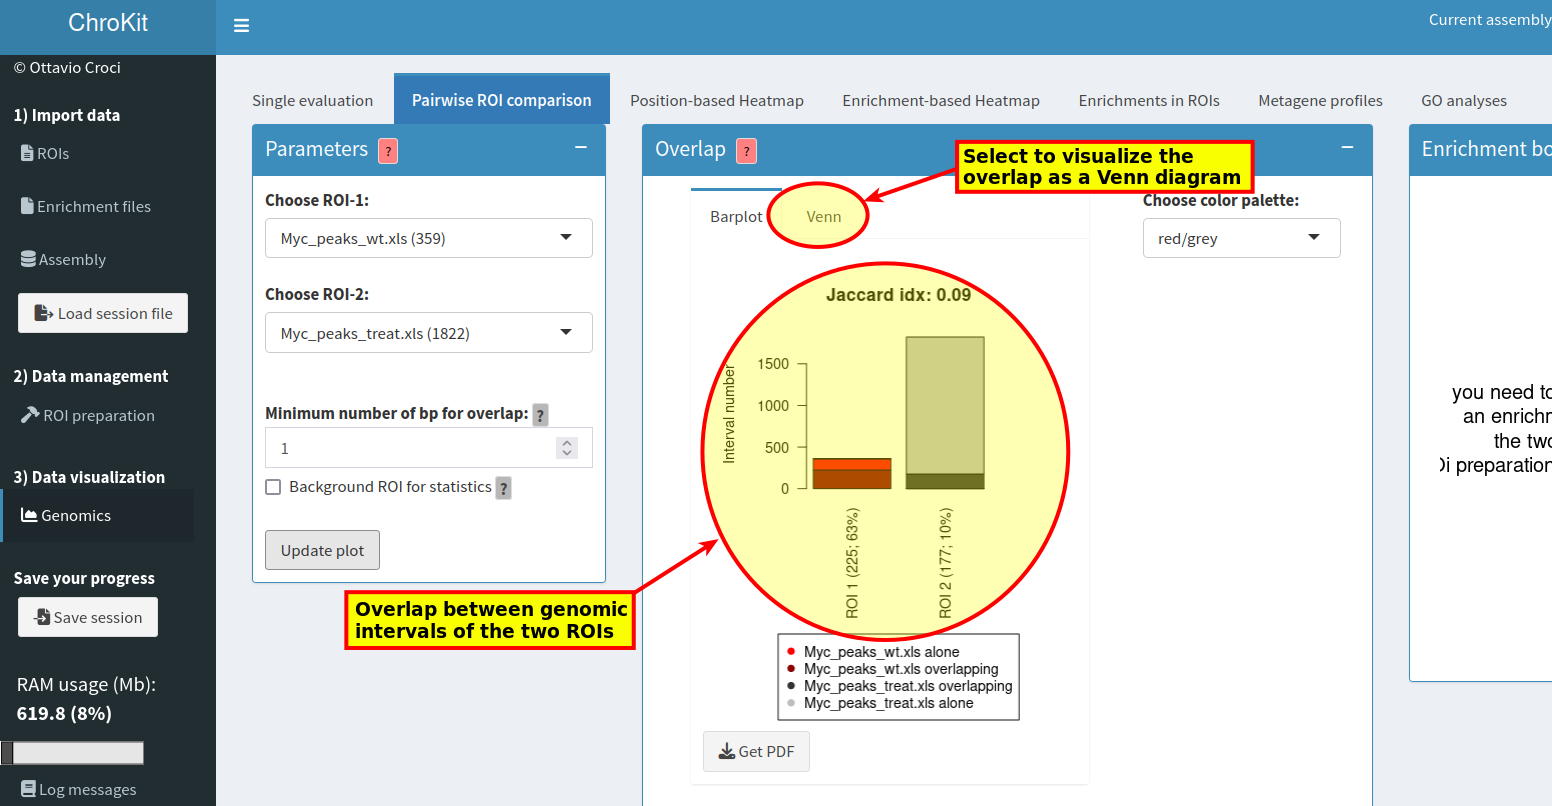
Then, visualize the results:
Option 1: With the example data
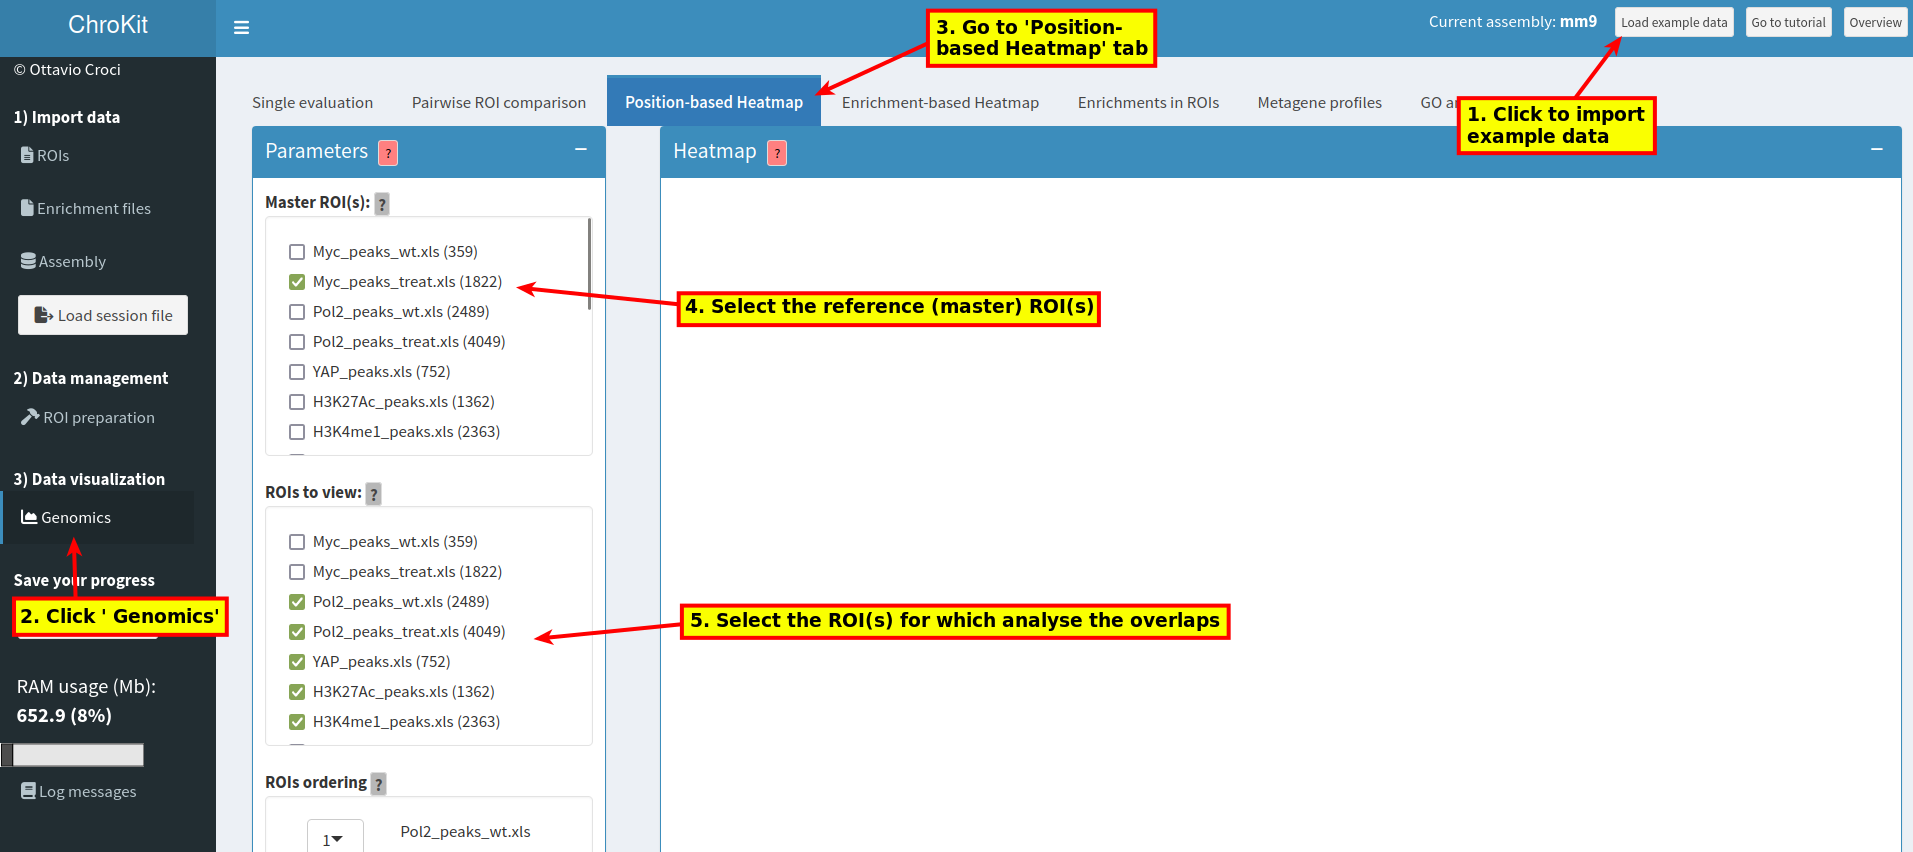
Load the example data (1), click 'Genomics' (2) and select the 'Position-based heatmap' tab (3).
Option 2: With your own data
Alternatively, if you have your own ROIs, start from step 2 and select the ROIs that you want to analyze (step 4, 5):
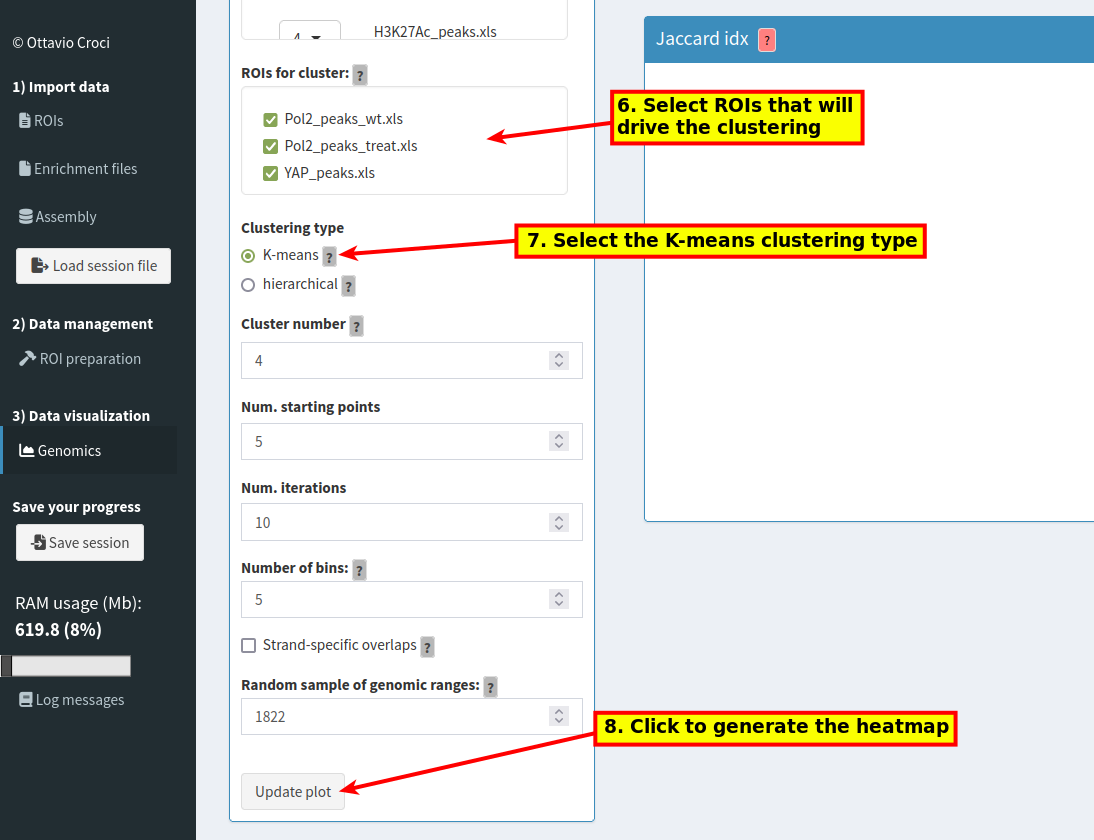
Scroll down for further options:
Then, visualize the results and, optionally, extract new ROIs from a particular combination of overlaps:
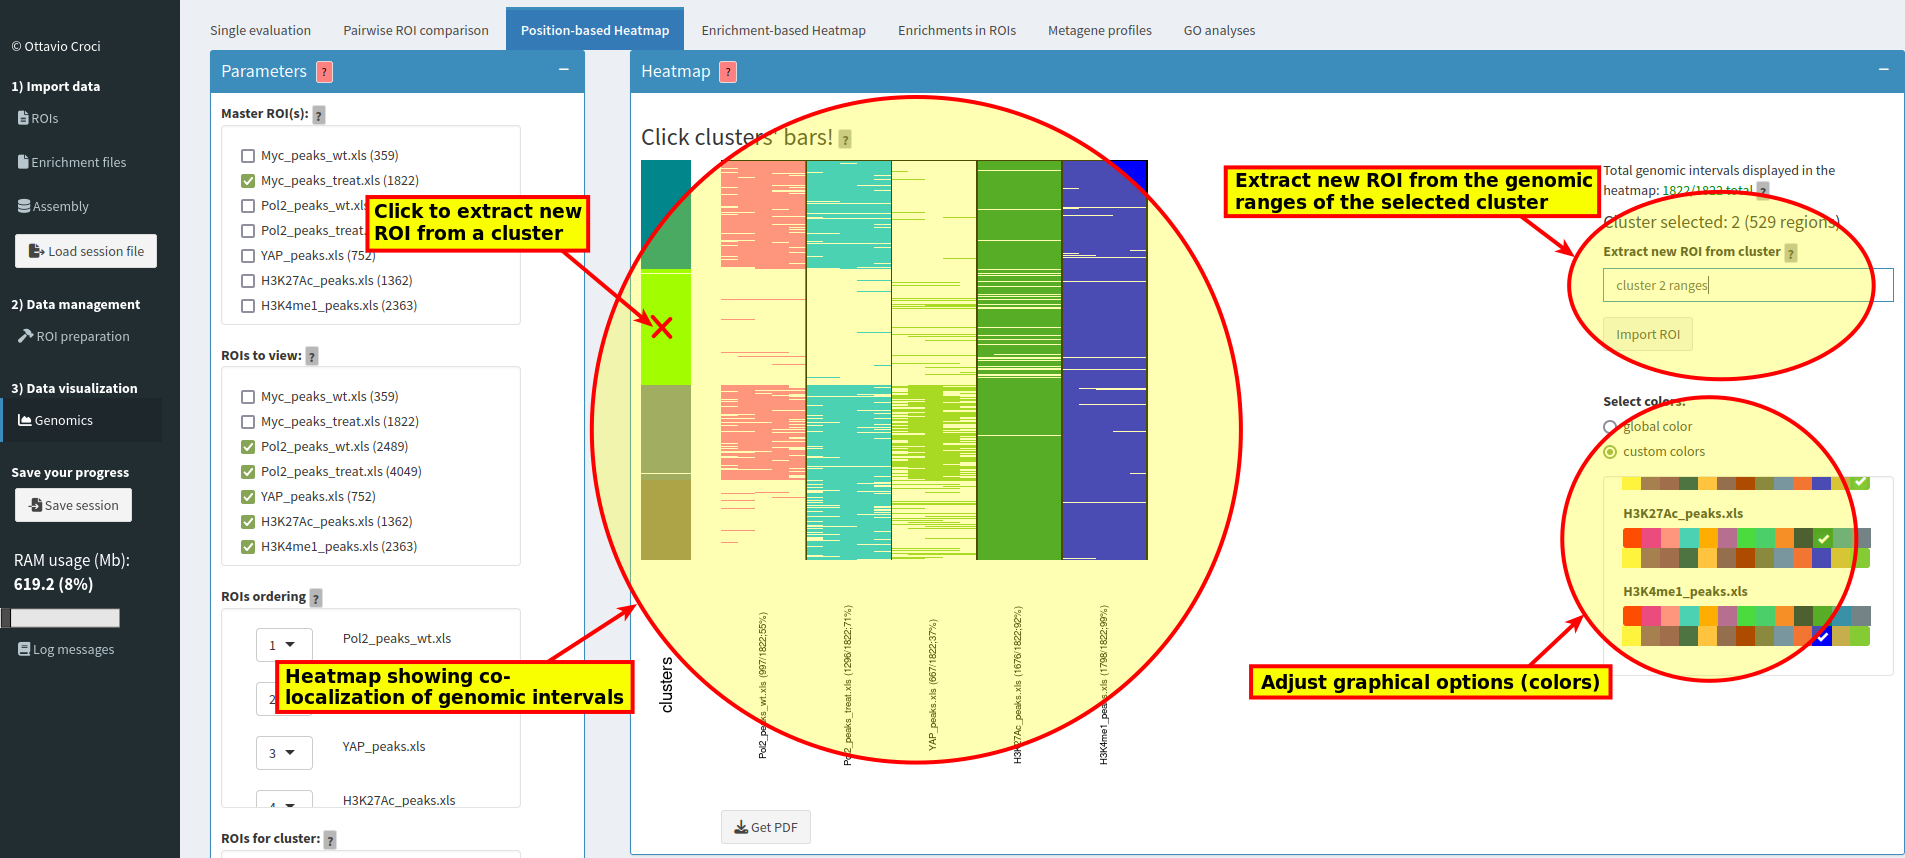
Scroll down for further output boxes:
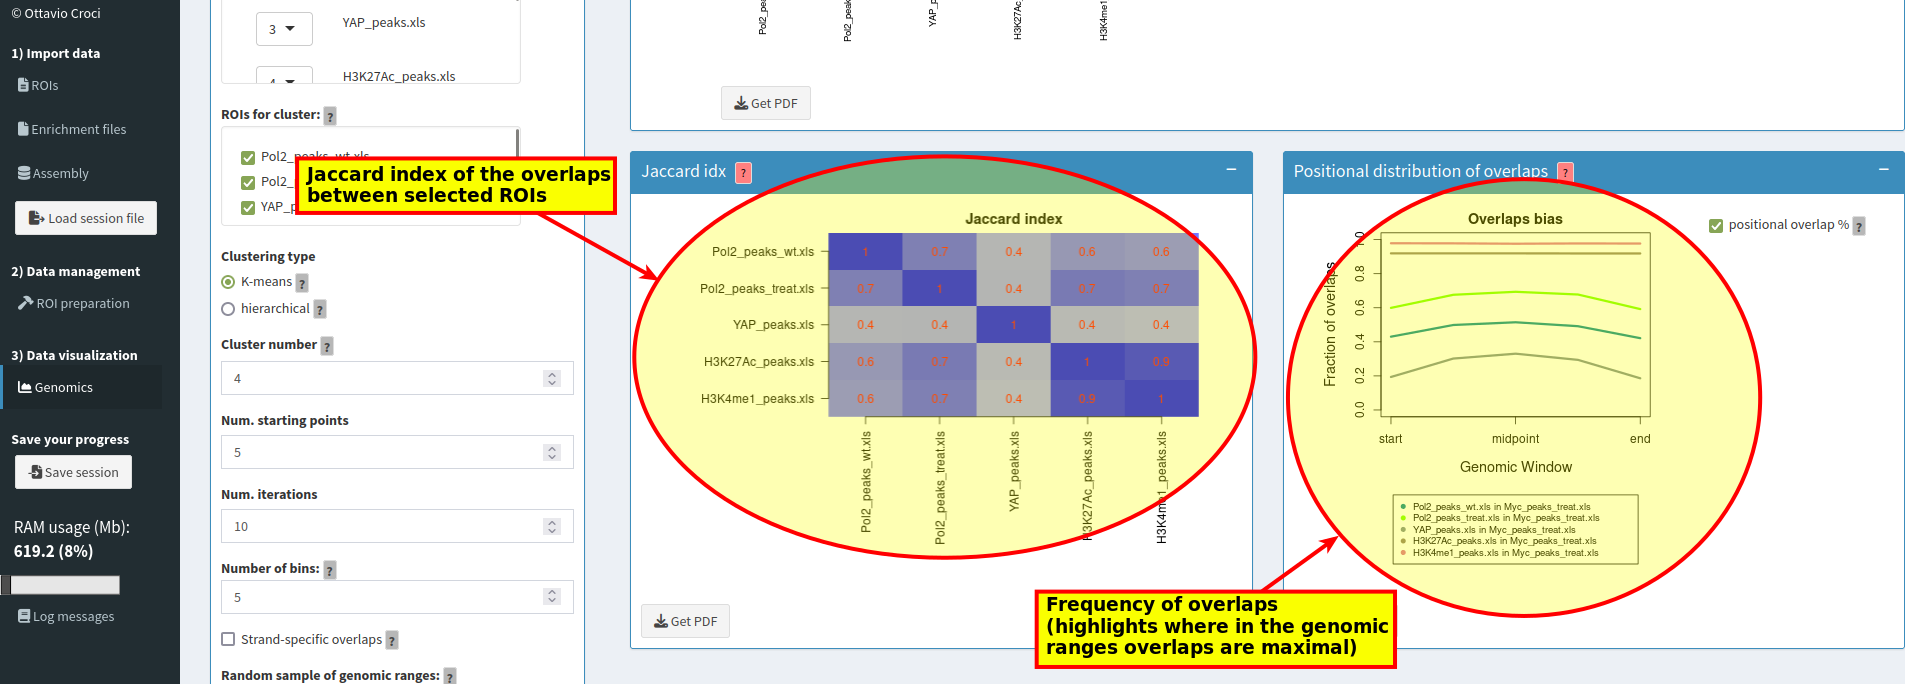
Option 1: With the example data
Load the example data (1), click 'Genomics' (2) and select the GO analyses tab (3).
Option 2: With your own data
Alternatively, if you have your own ROIs or a custom gene list, start from step 2 and select the ROIs or genelist that you want to analyze (step 4, 5):
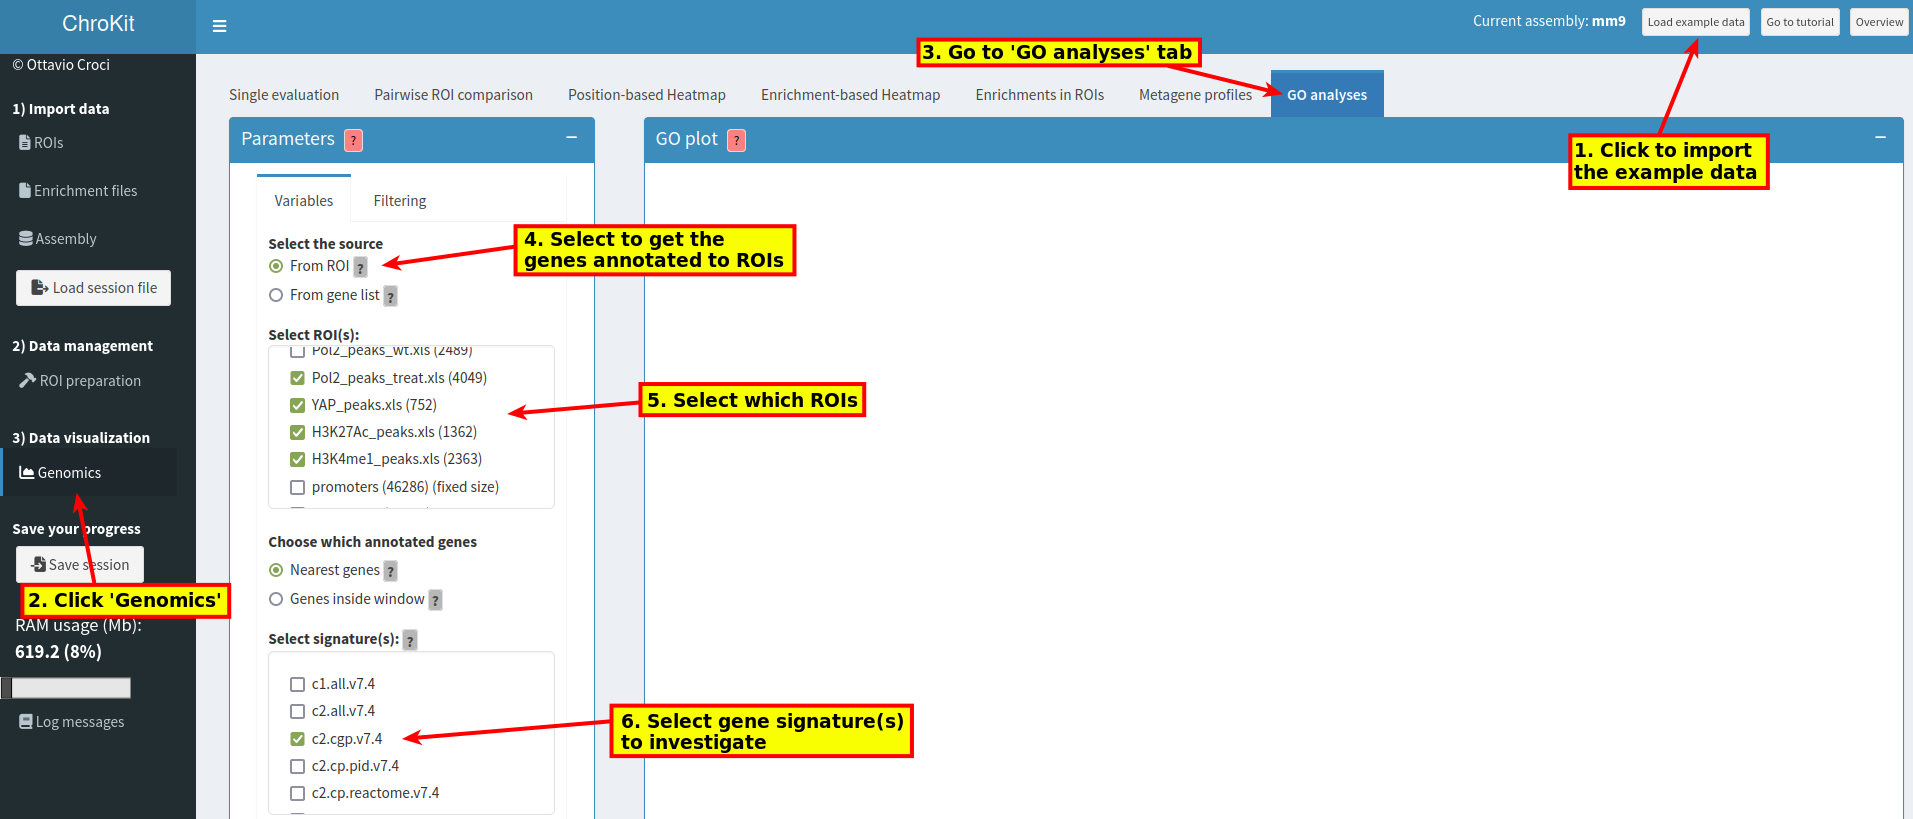
Scroll down for further options:
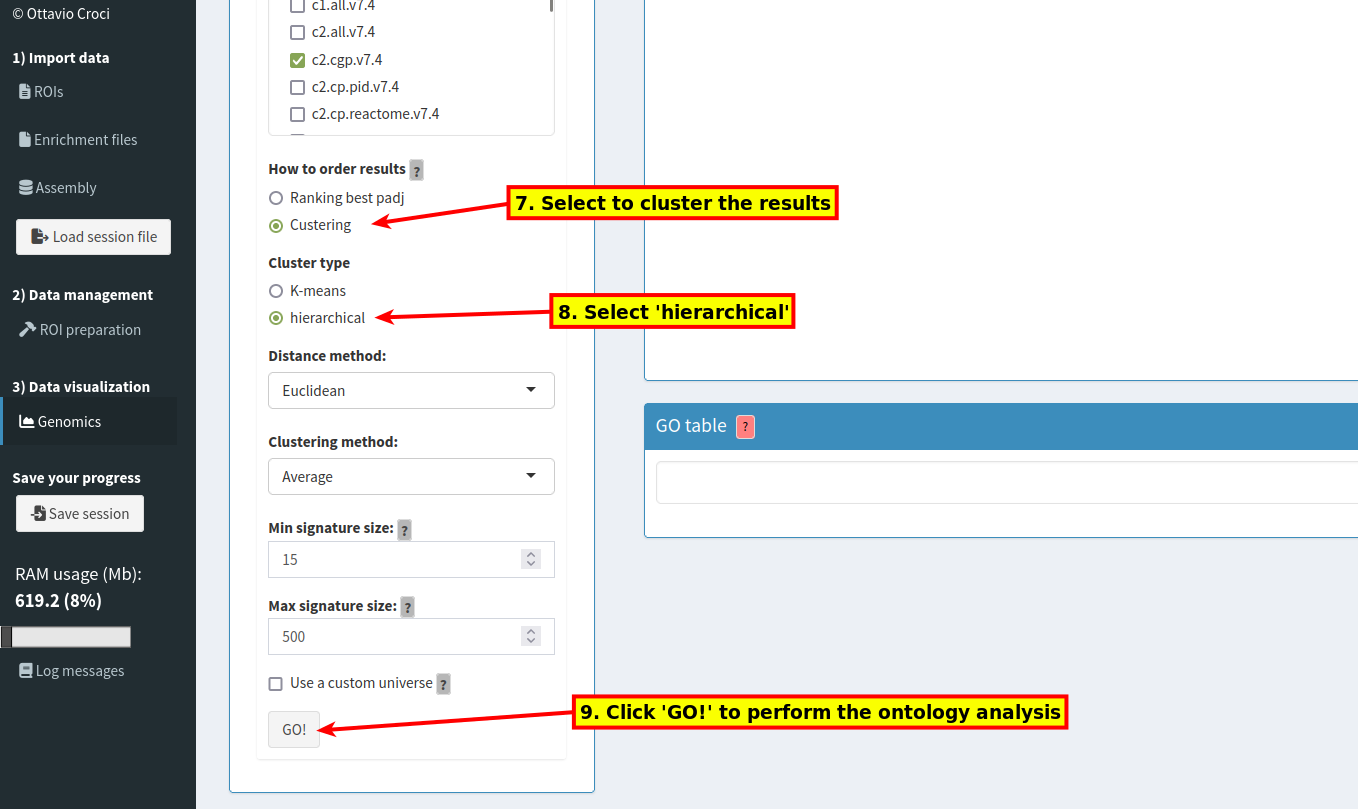
Then, visualize or download the results:
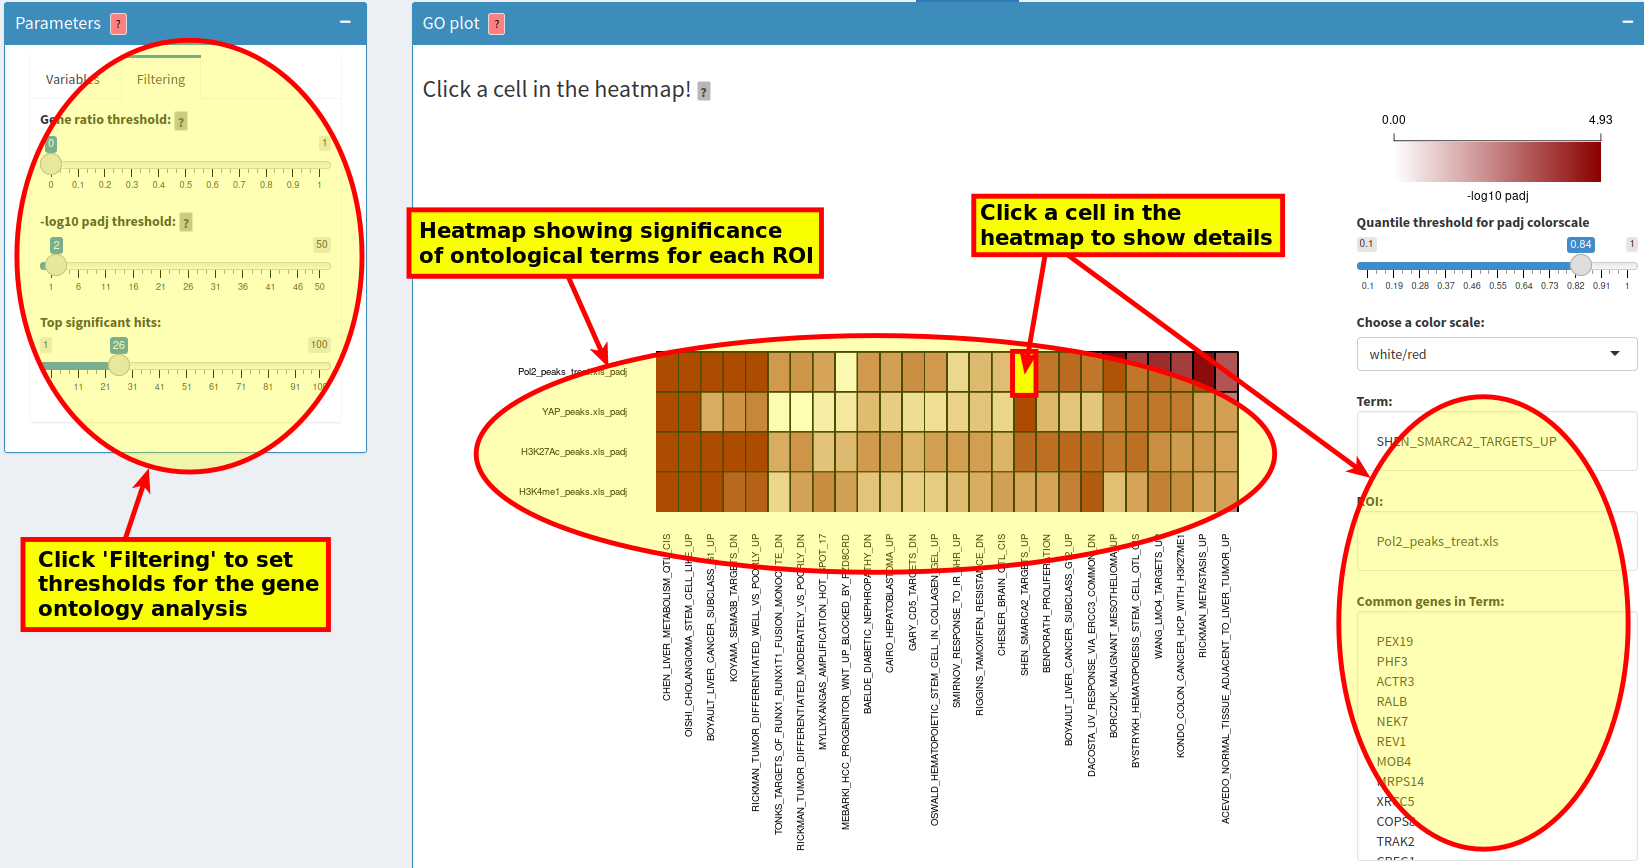
Scroll down for further output:
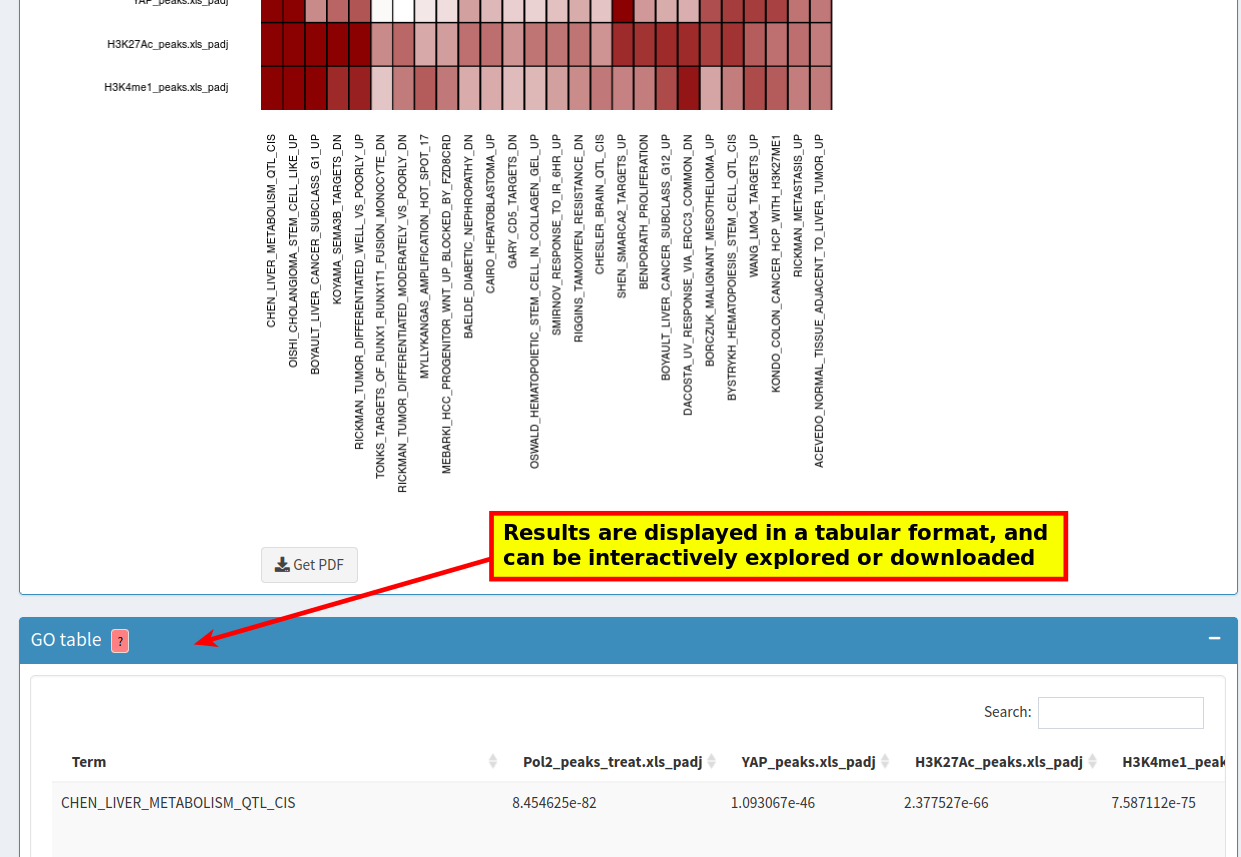
Option 1: With the example data
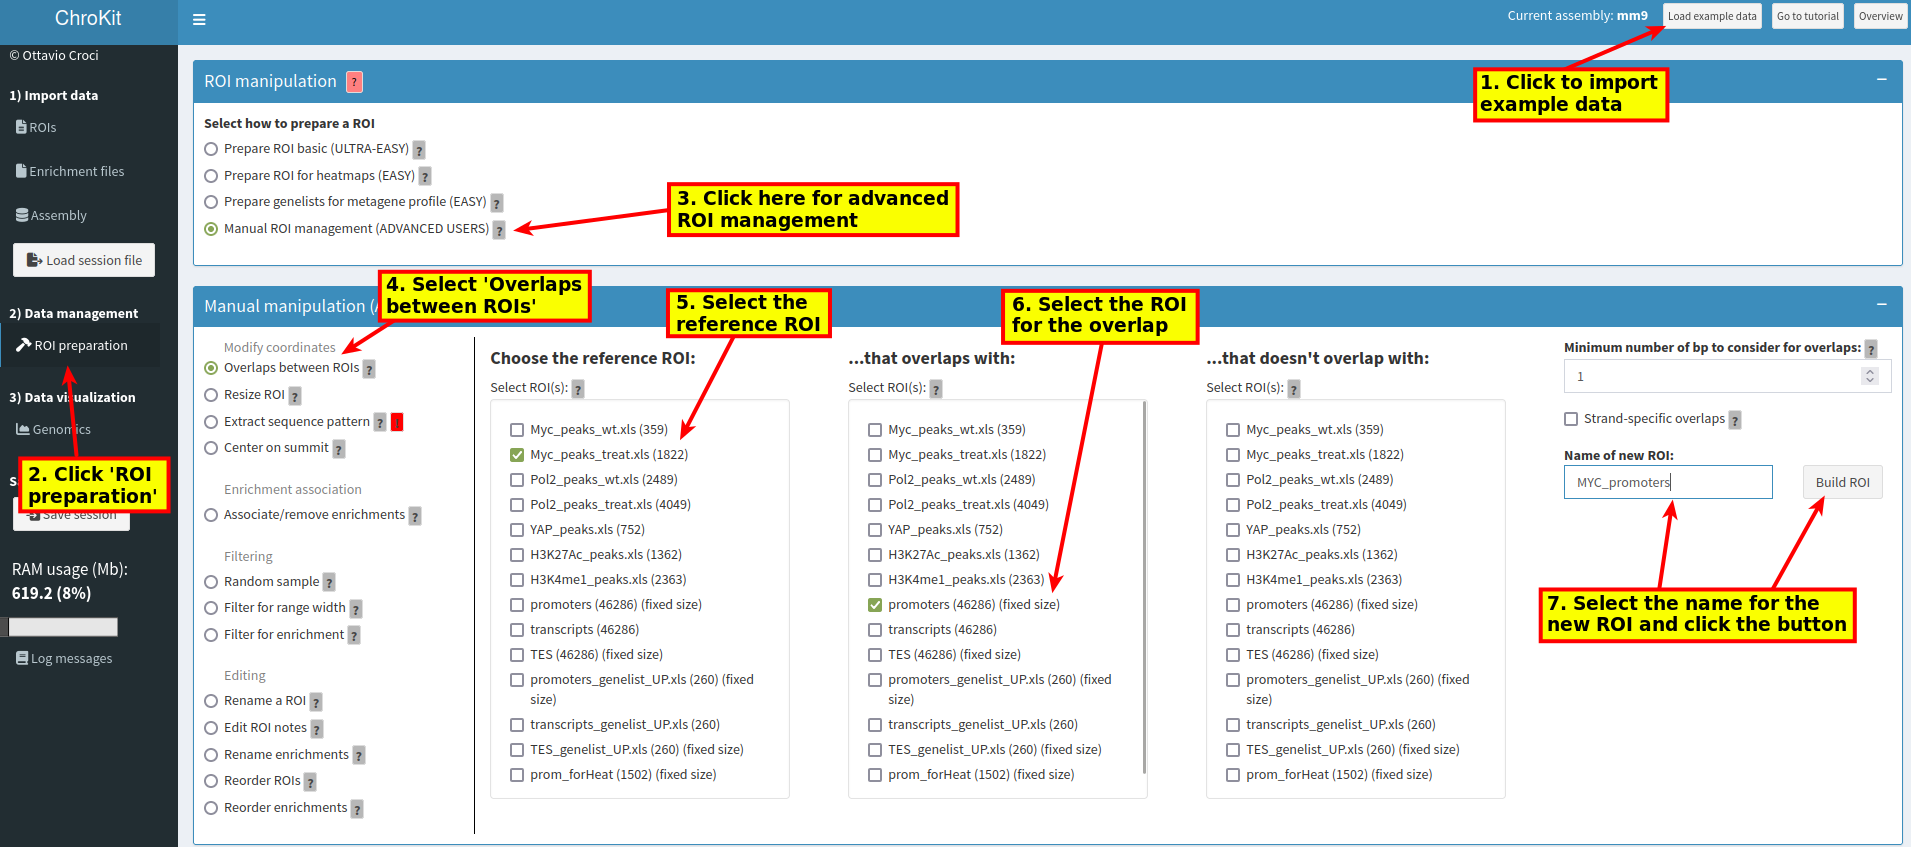
Load the example data (1), click 'ROI preparation' (2) and follow the steps to subset ROIs based on overlaps.
Option 2: With your own data
Alternatively, if you have your own ROIs, start from step 2 and select the ROIs to generate the subset (step 5,6) (In the example below, you will find Myc peaks overlapping with promoters).
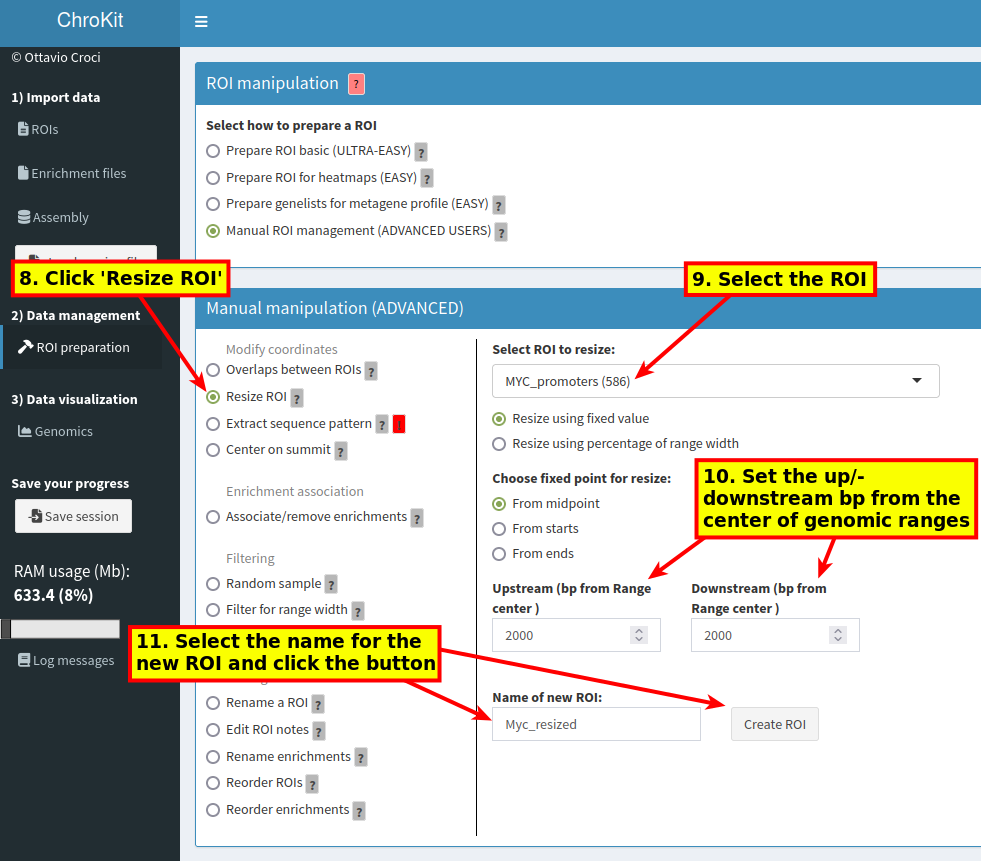
Then, resize the genomic ranges of the ROI created before (i.e. Myc_promoters), for a better visualization in the heatmap:
Extract the sequence patterns from the ROI created in the previous step (Myc_resized). In the example below, you will find the E-box motif.
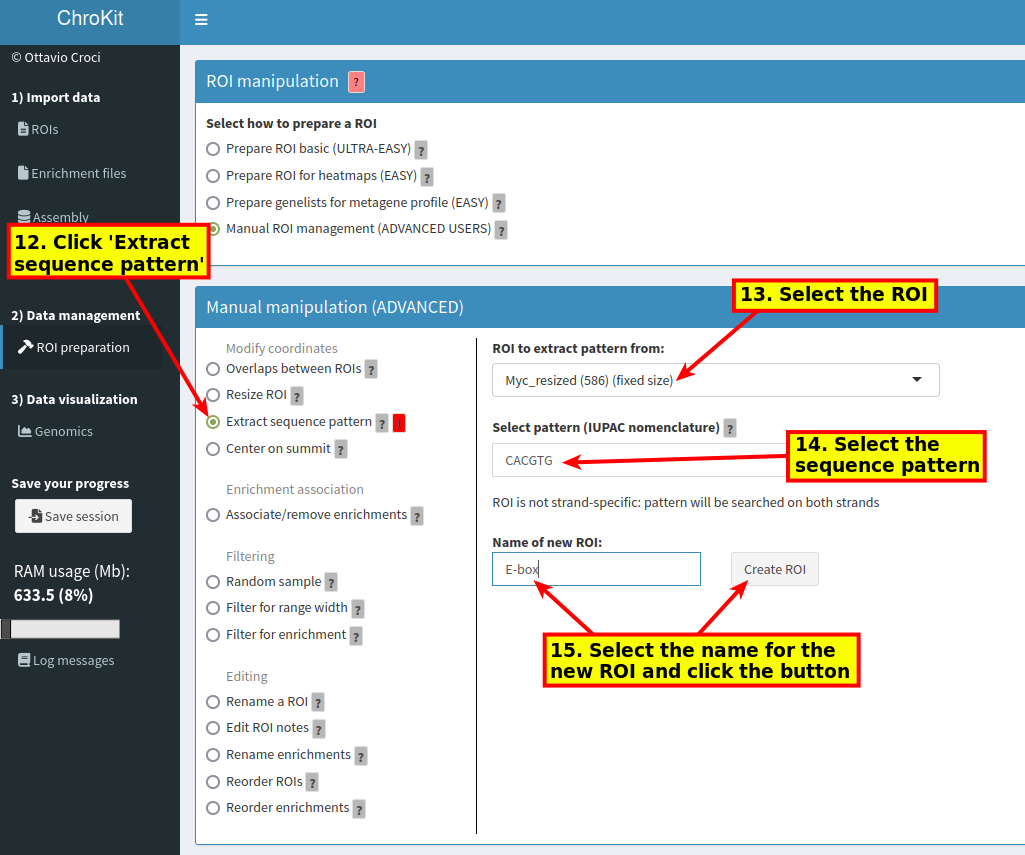
Build a heatmap to visualize sequence pattern occurrences within the ROI. Click 'Genomics' (16), go to 'Position-based Heatmap' (17) and follow the steps:
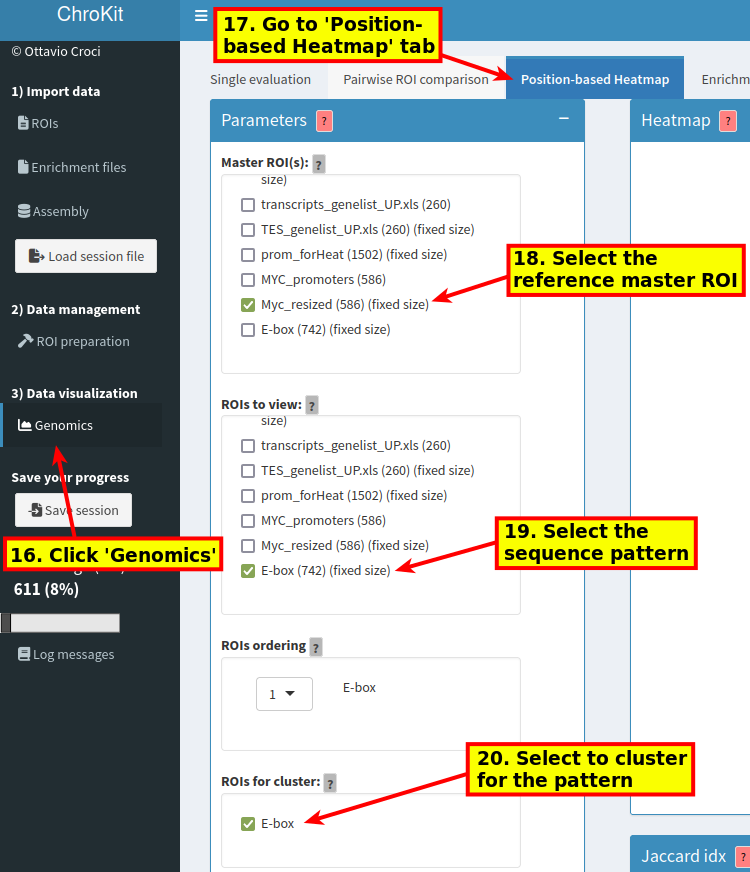
Scroll down for further options:
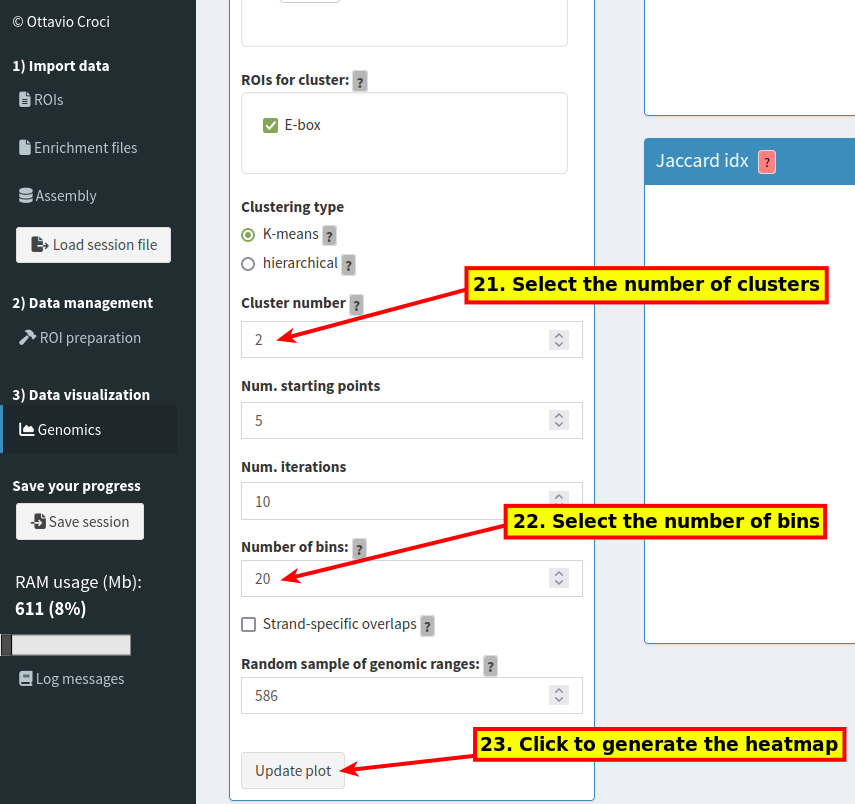
Visualize, in a heatmap, the sequence patterns within the ROI:
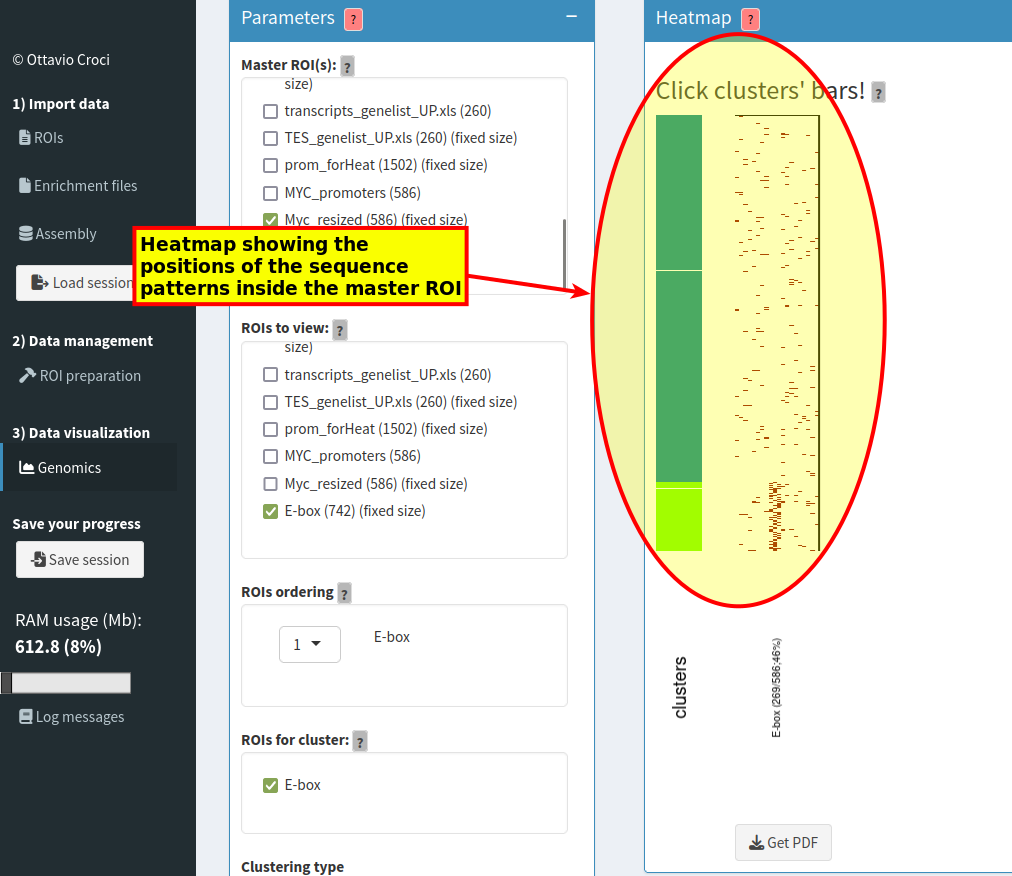
For further information about position-based heatmaps, go to How can I analyse multiple or complex overlaps with a heatmap?
Option 1: With the example data
Load the example data (1), click 'ROI preparation' (2) and follow the steps.
Option 2: With your own data
Alternatively, if you have your own ROIs and enrichments, start from step 2 and select the ROI and enrichments that you want to analyze (step 4, 5):
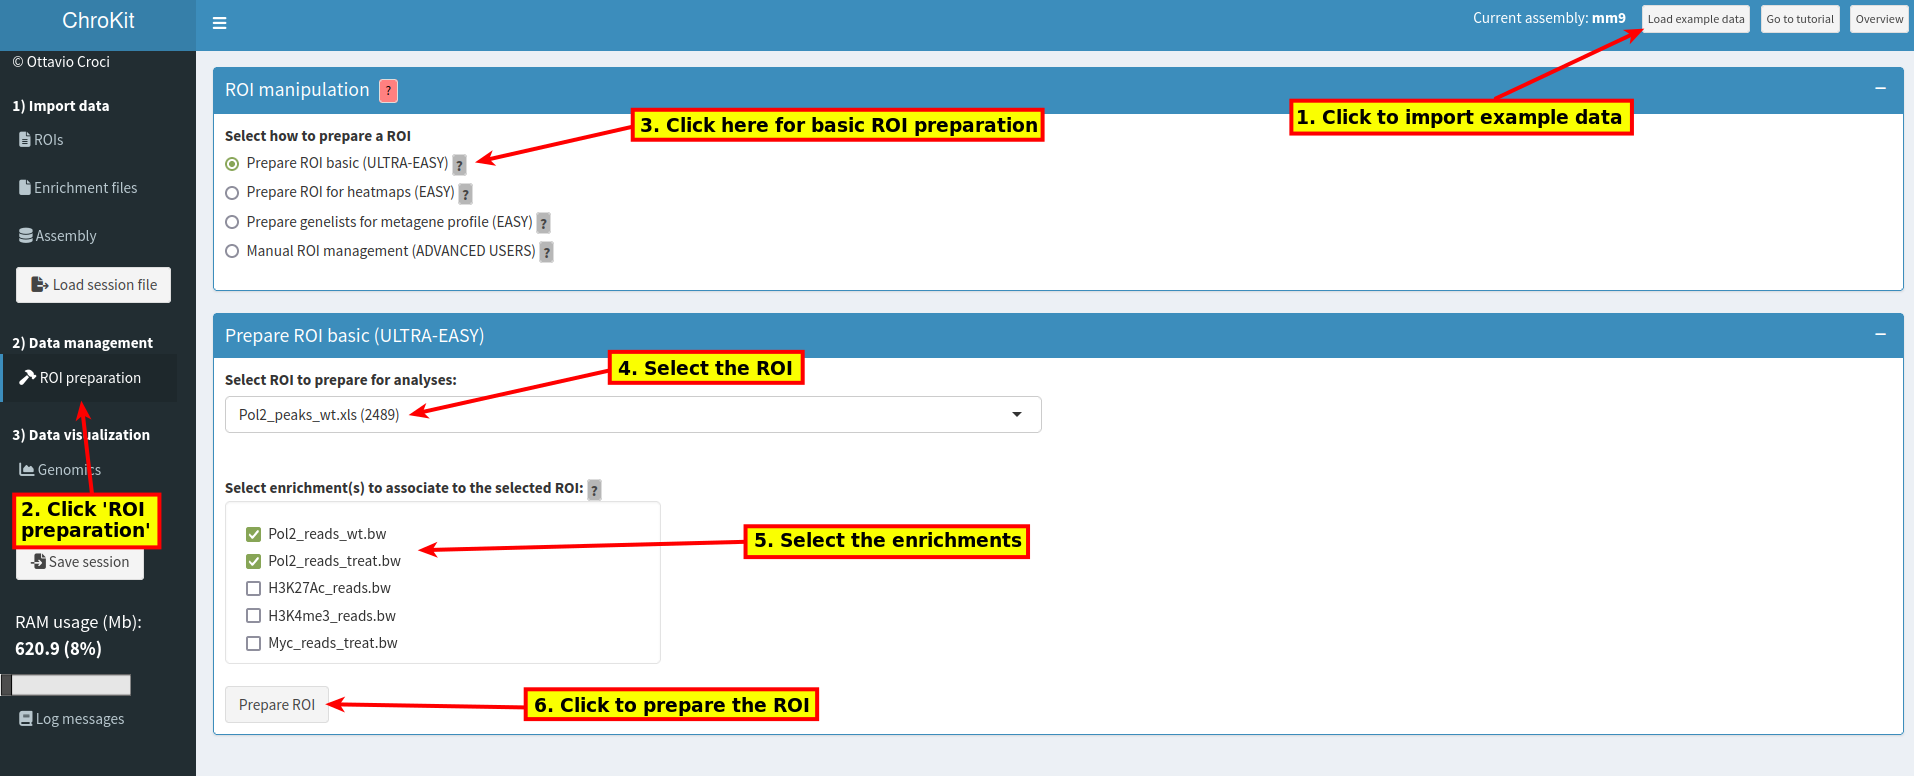
Repeat the steps 4, 5, 6 for the second ROI (Pol2_peaks_treat.xls):
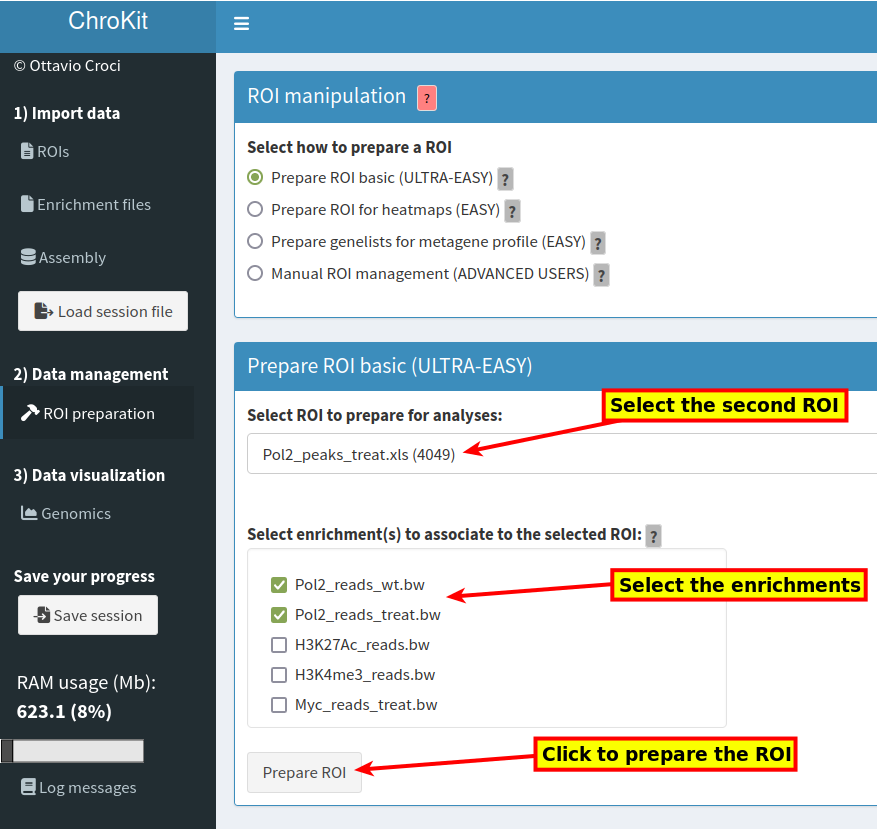
Once the enrichments are associated to ROIs, click 'Genomics' (7) to proceed with the analyses:
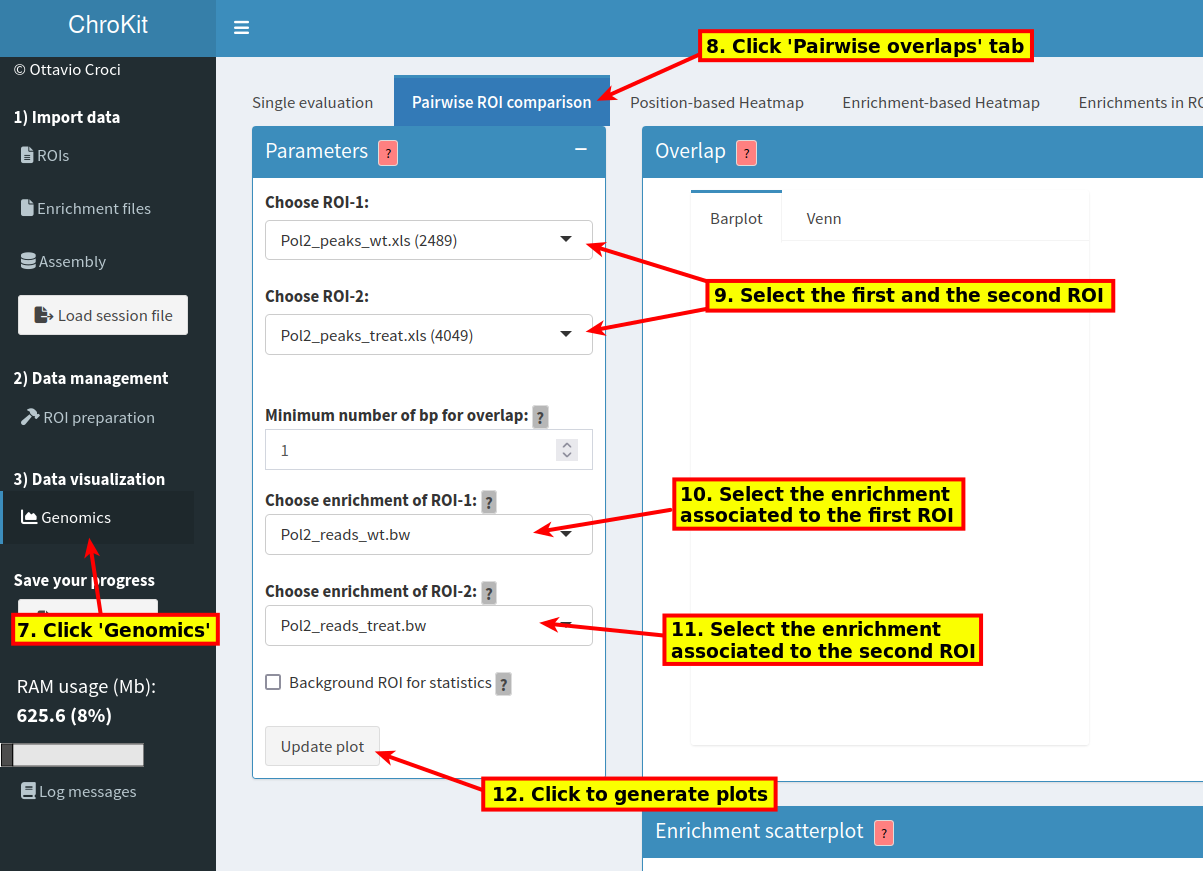
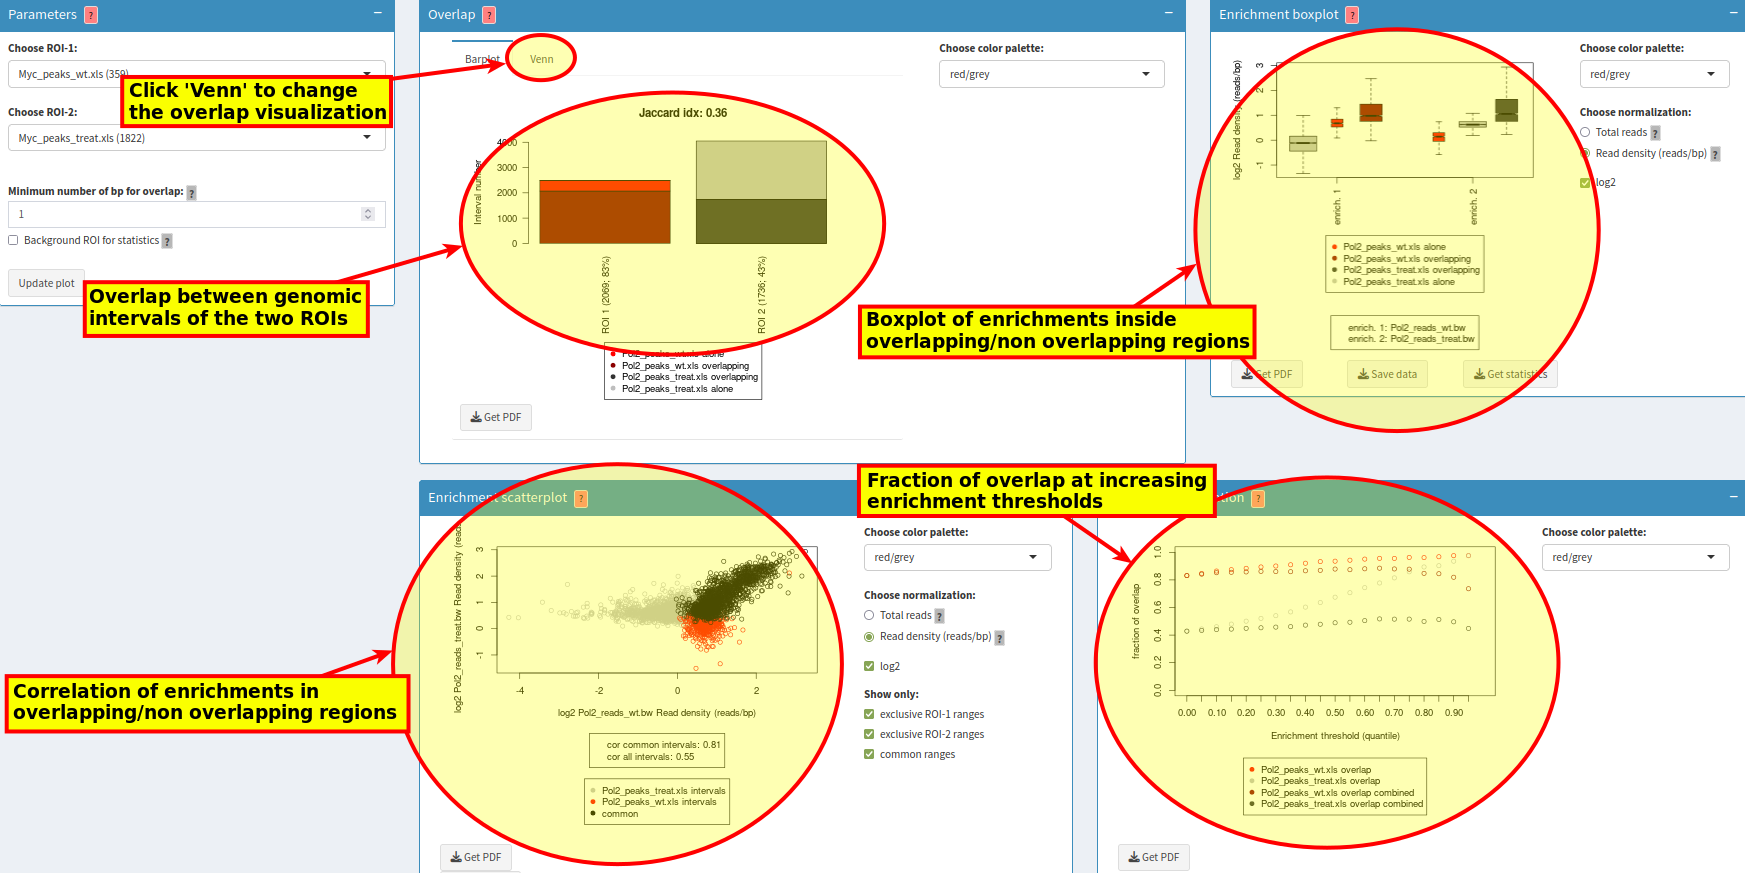
Then, visualize or download the results:
Option 1: With the example data
Load the example data (1), click 'ROI preparation' (2) and follow the steps.
Option 2: With your own data
Alternatively, if you have your own ROIs and enrichments, start from step 2 and select the ROI and enrichments that you want to analyze (step 4, 5):
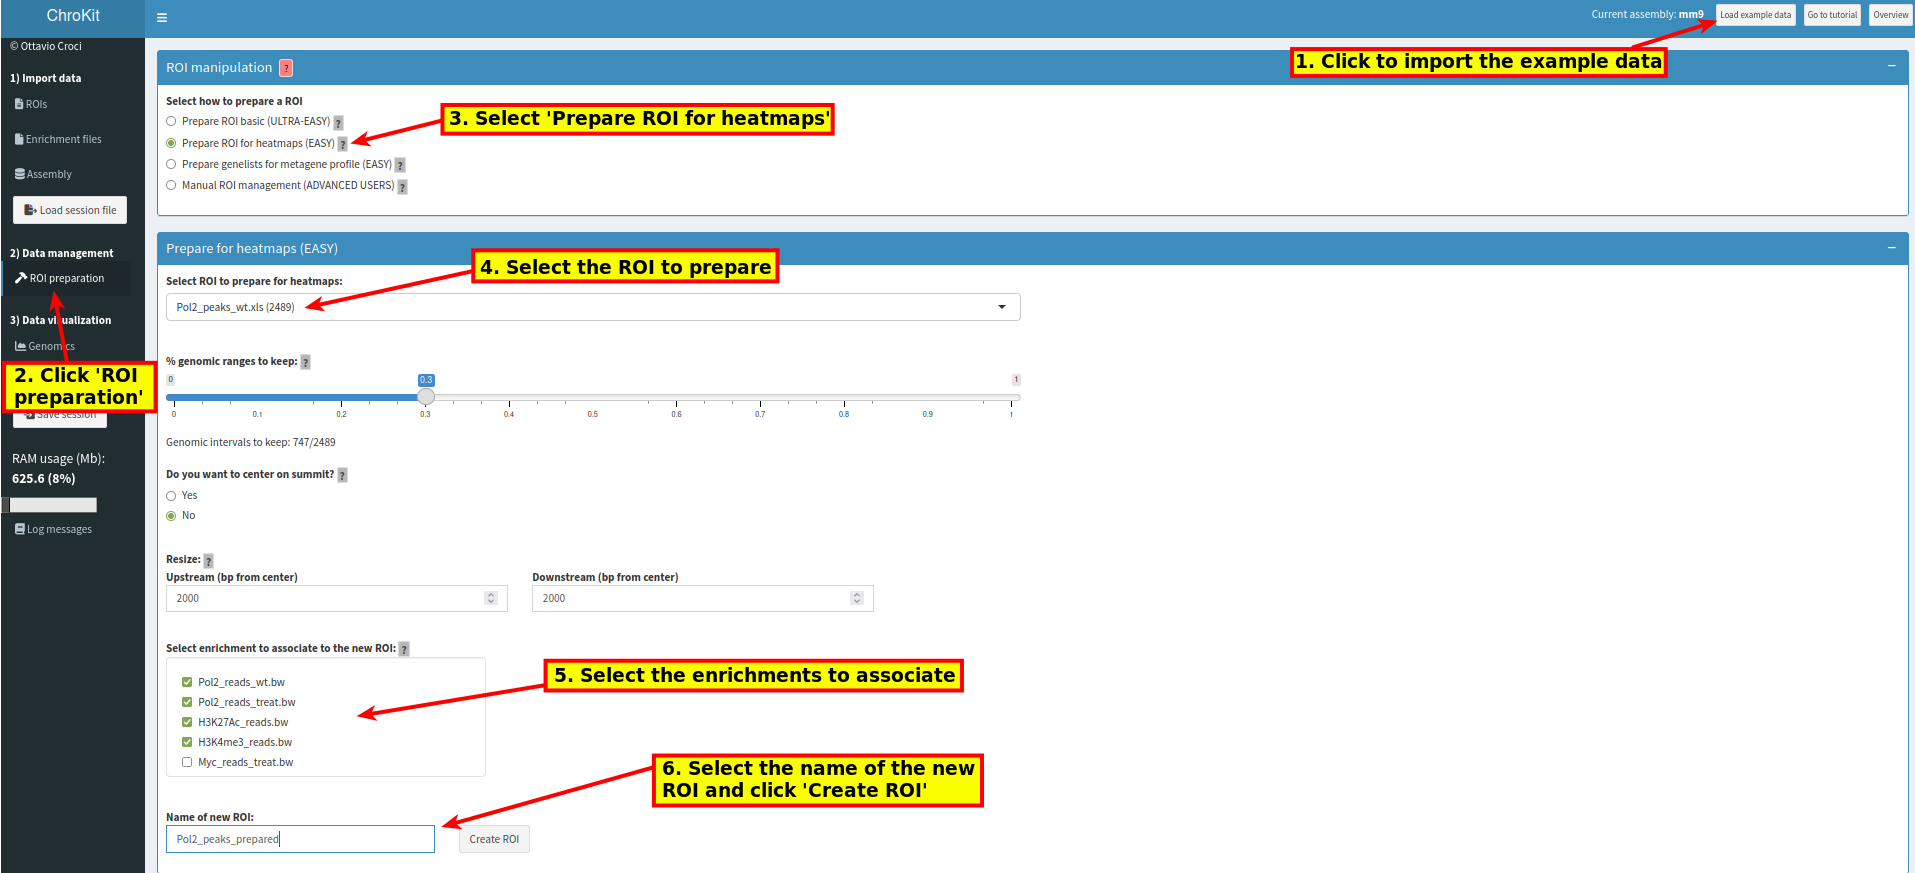
Scroll down for further options:
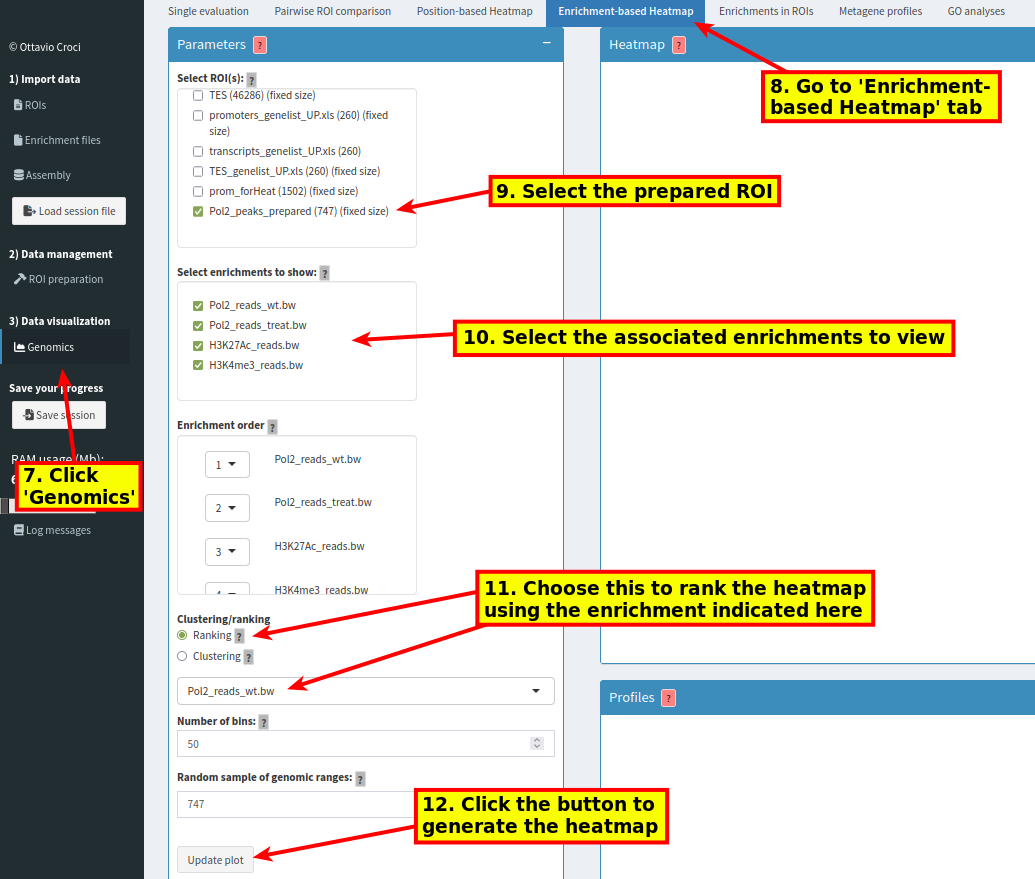
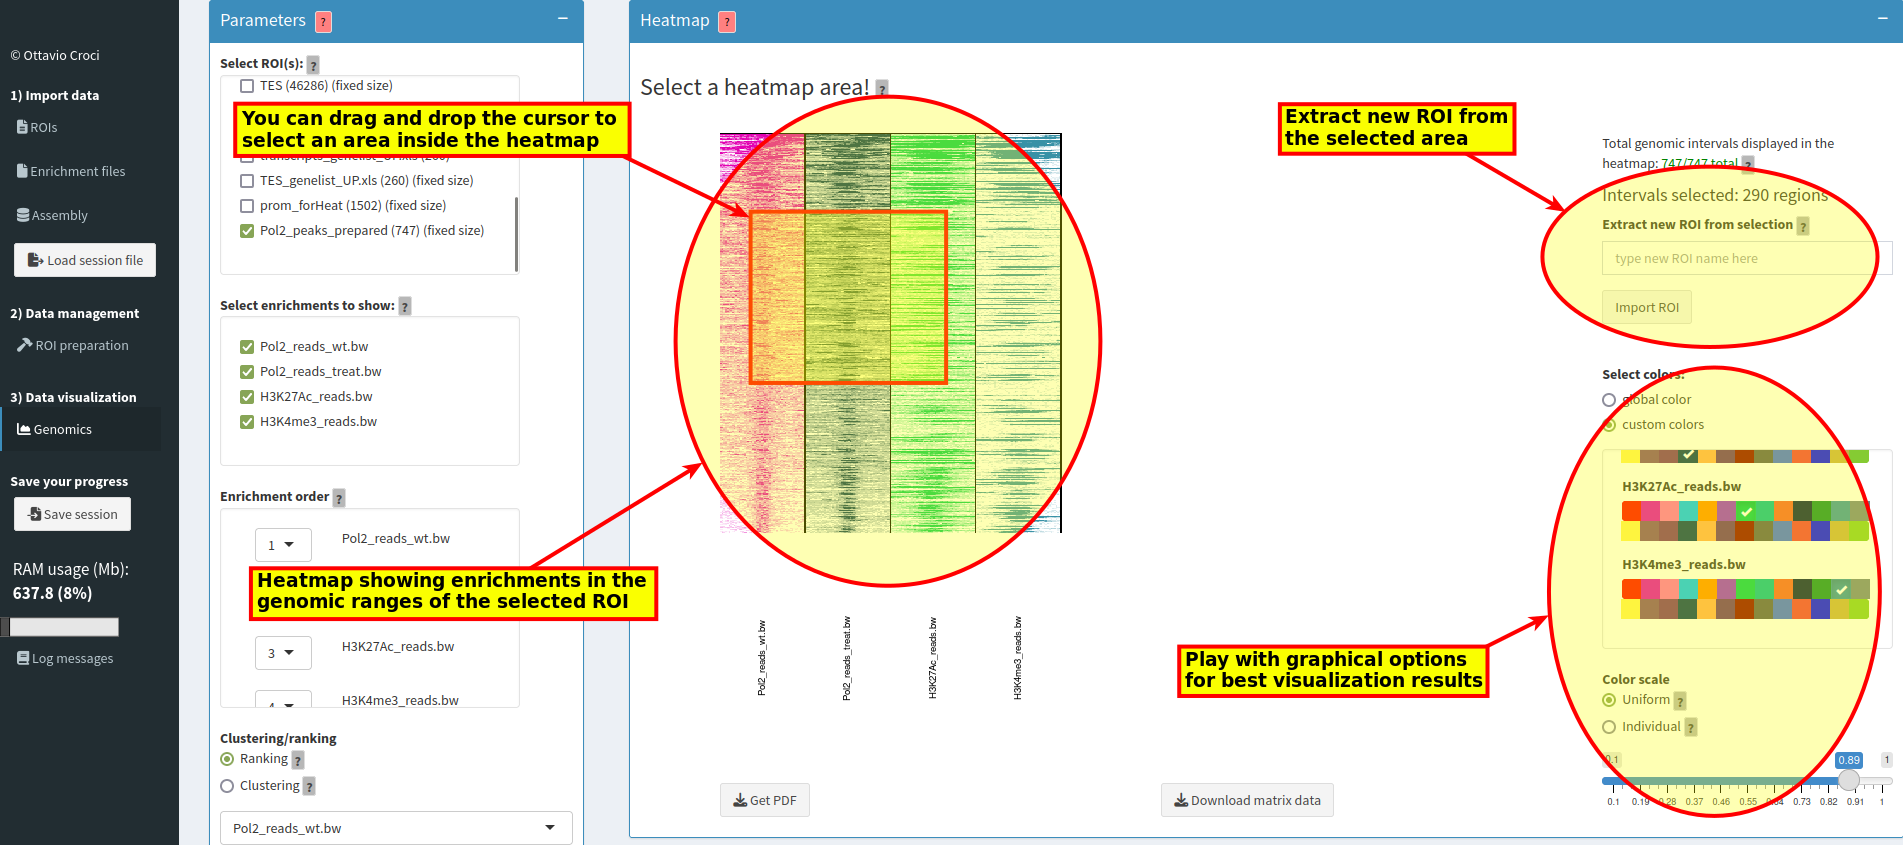
Then, play interactively with the heatmap by changing the selected area. Visualize or download the results:
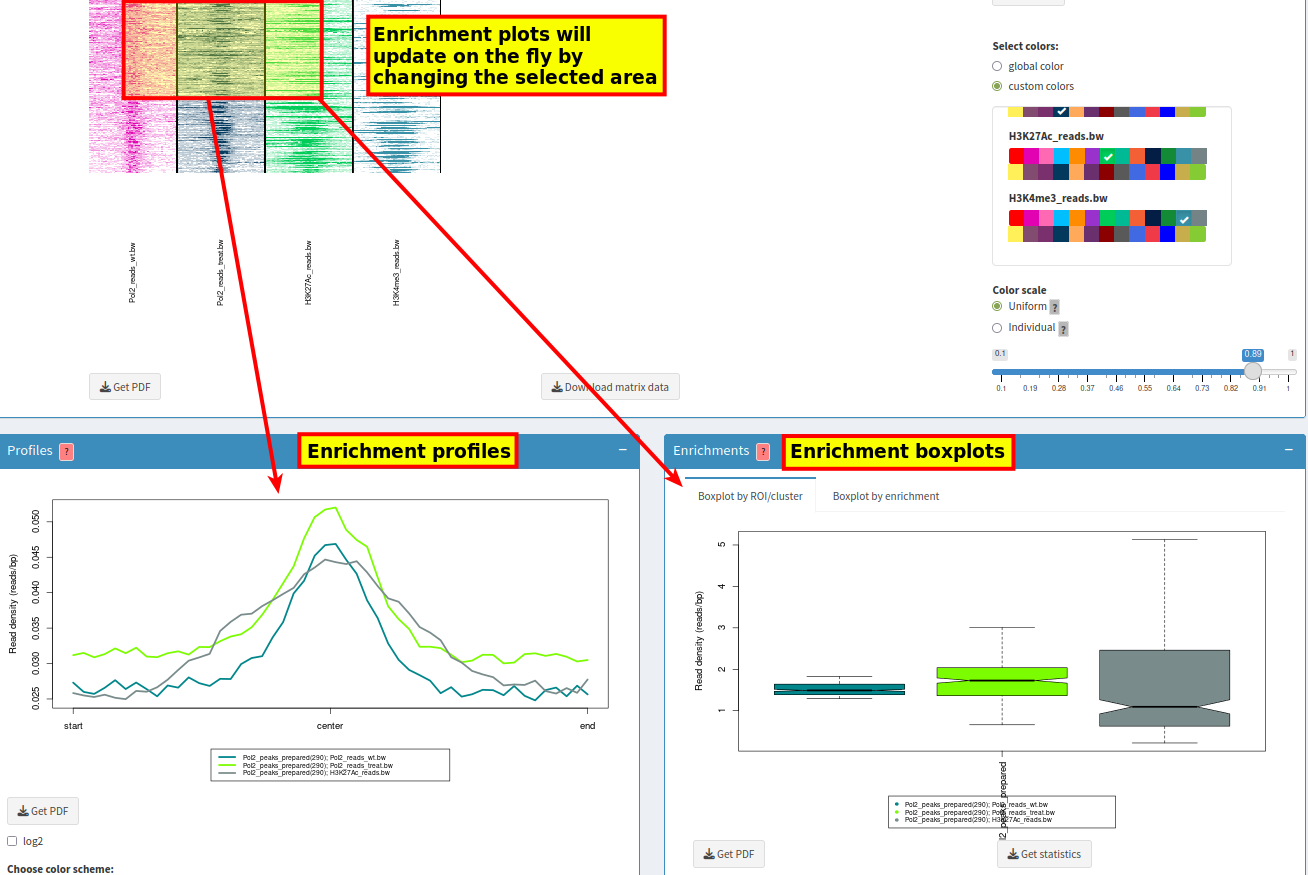
Scroll down for further output boxes:
Option 1: With the example data
Load the example data (1), click 'Genomics' (2) and follow the steps.
Option 2: With your own data
Alternatively, if you have your own ROIs and enrichments, start from step 2 and select the ROI(s) and enrichments that you want to analyze (step 4, 5):
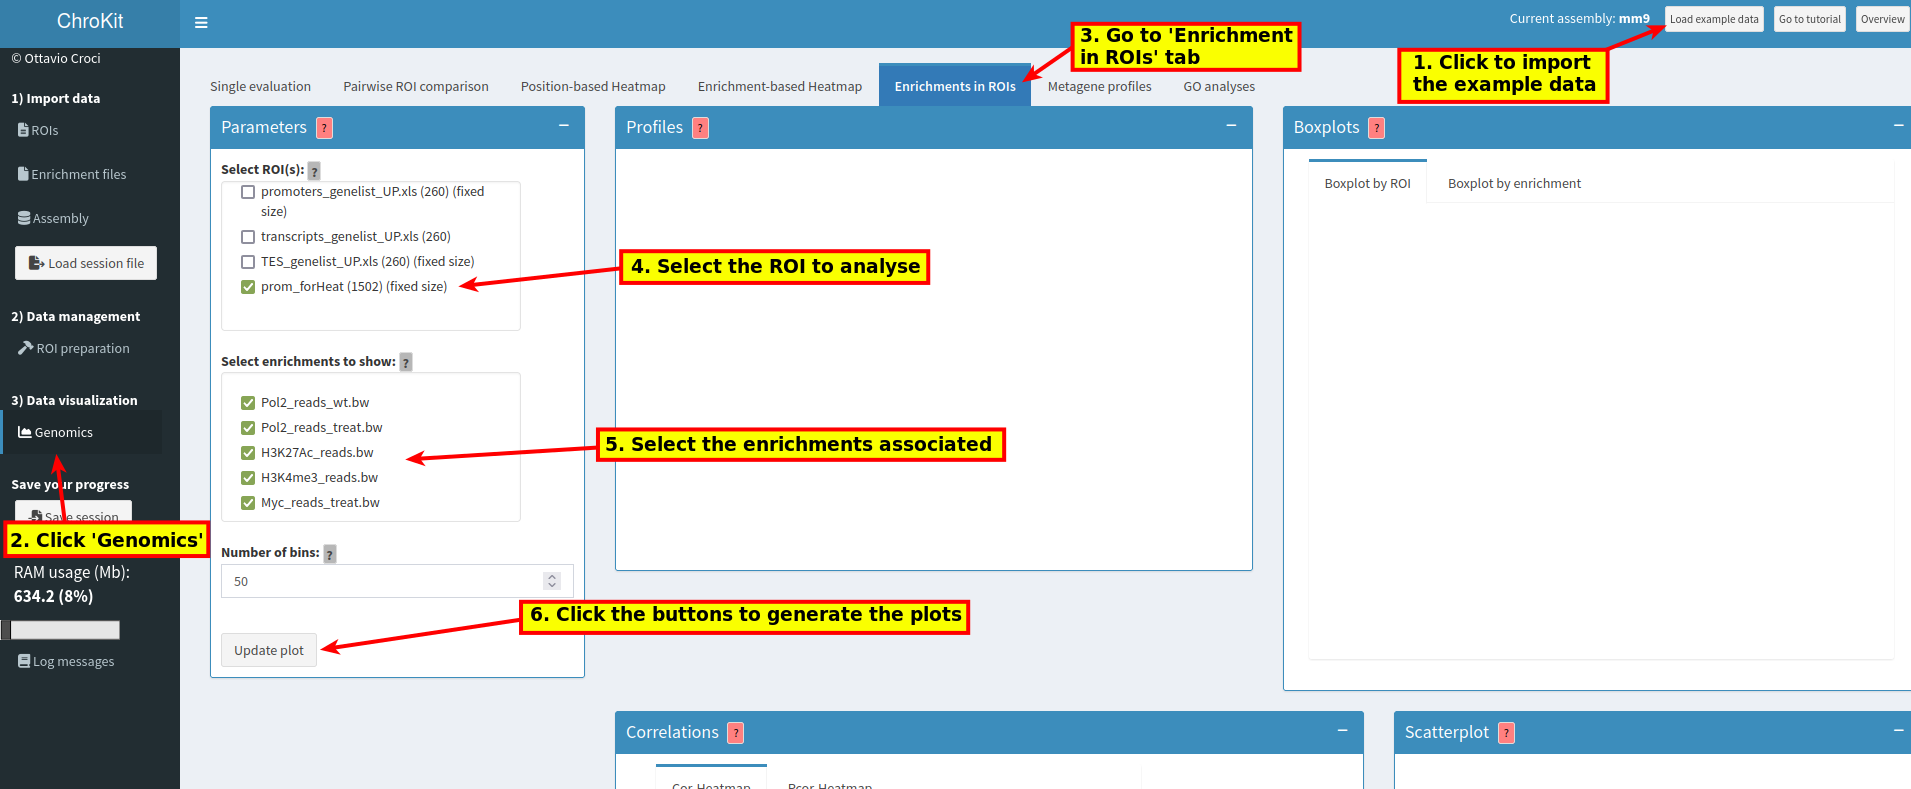
Output plots will appear on the right:
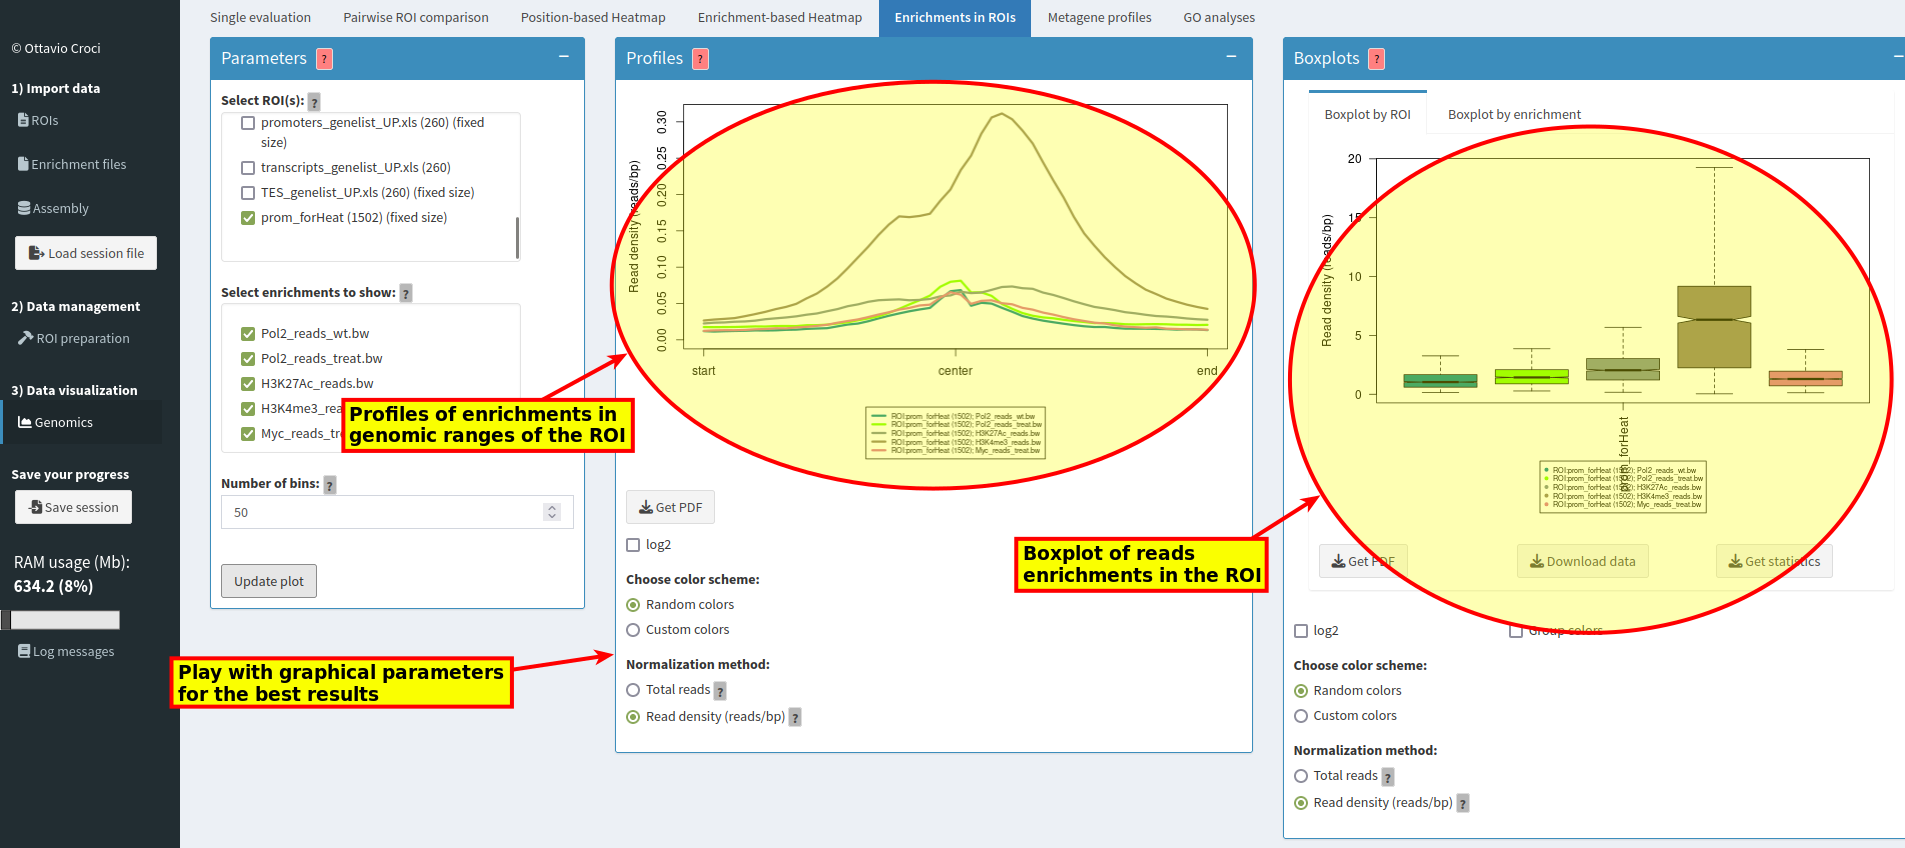
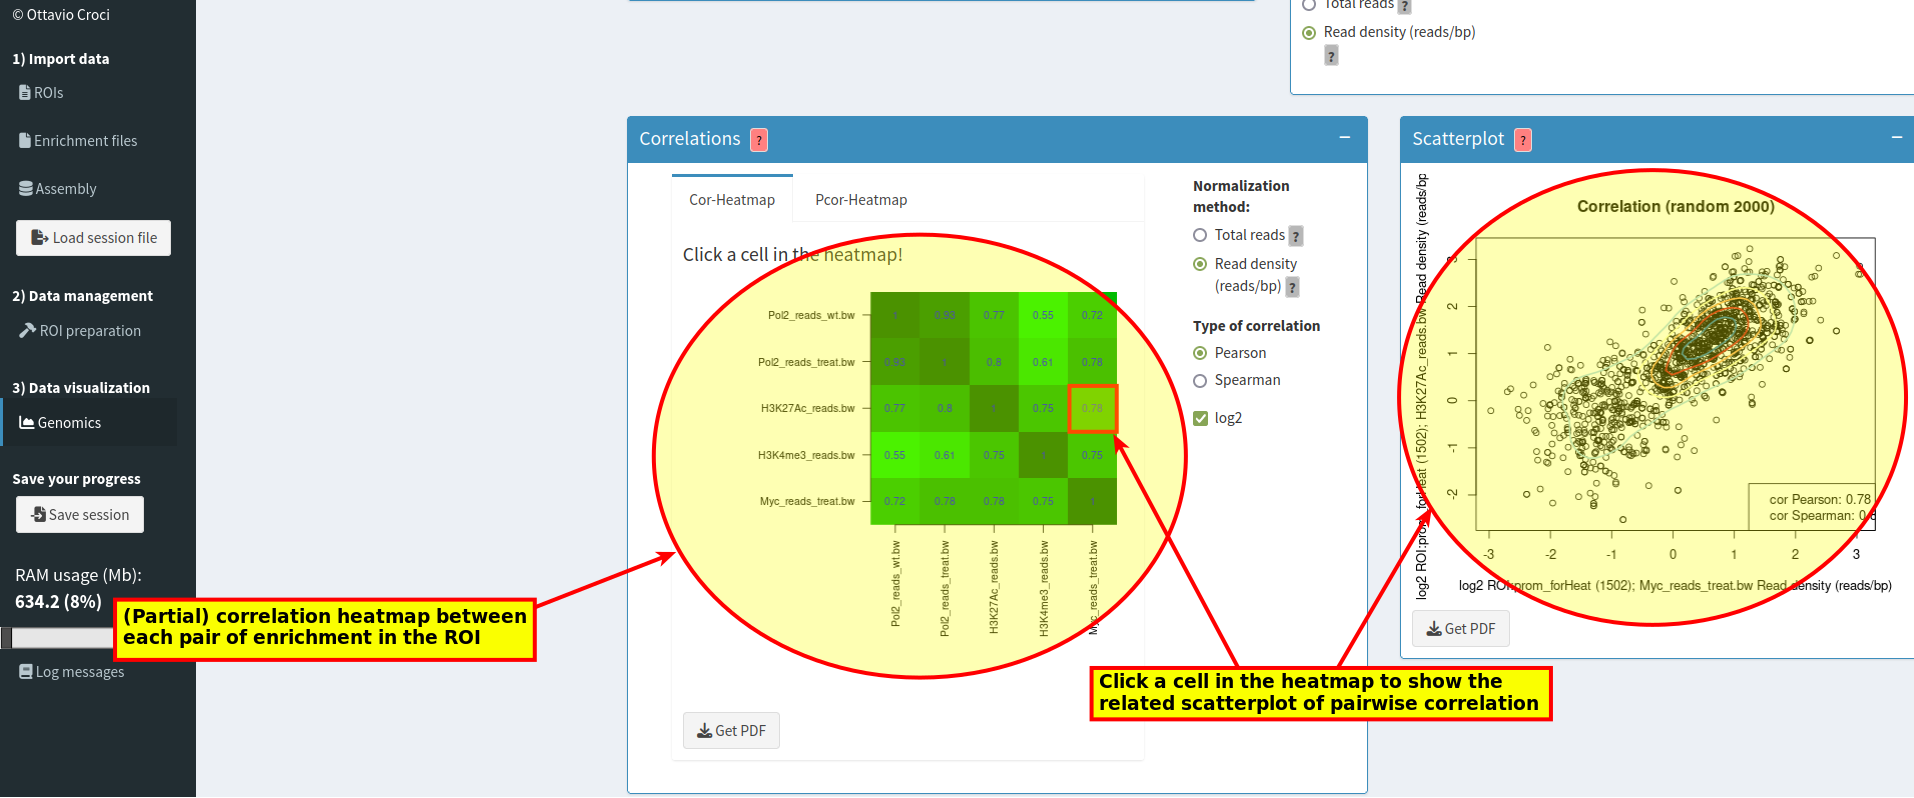
Scroll down for further output boxes. To view correlations, play interactively with the correlation heatmap by clicking the desired cells:
Option 1: With the example data
Load the example data (1), click 'Genomics' (2) and follow the steps.
Option 2: With your own data
Alternatively, if you have your own ROIs and enrichments, start from step 2 and select the ROI and enrichments that you want to analyze (step 4, 5):
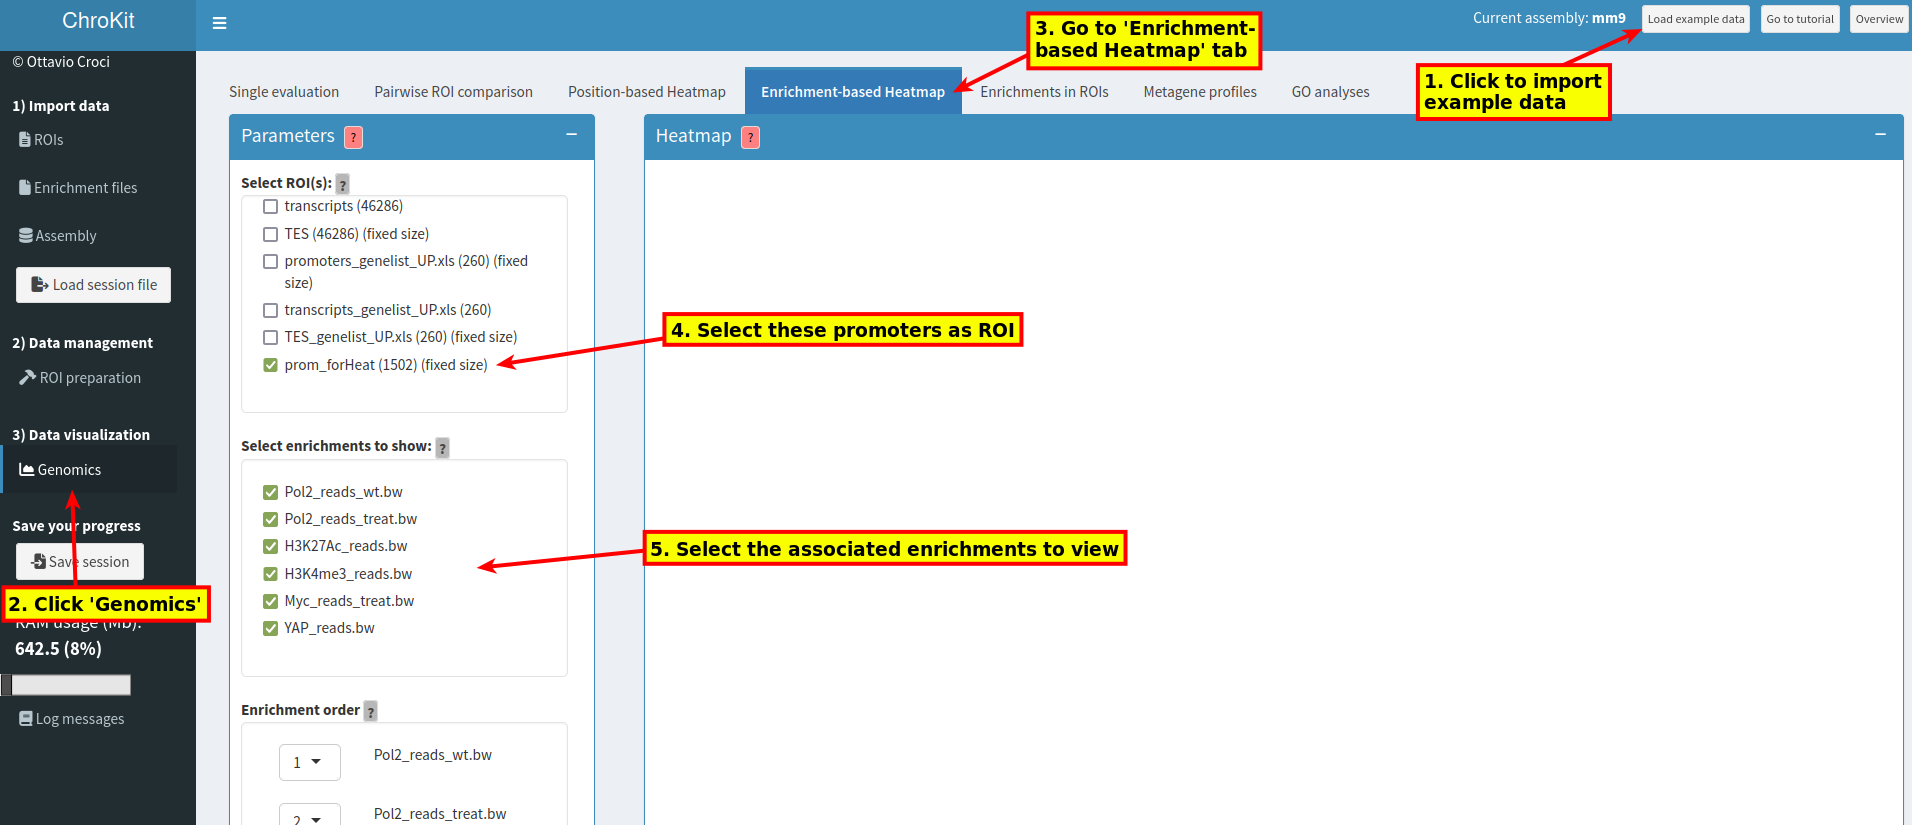
Scroll down for further options:
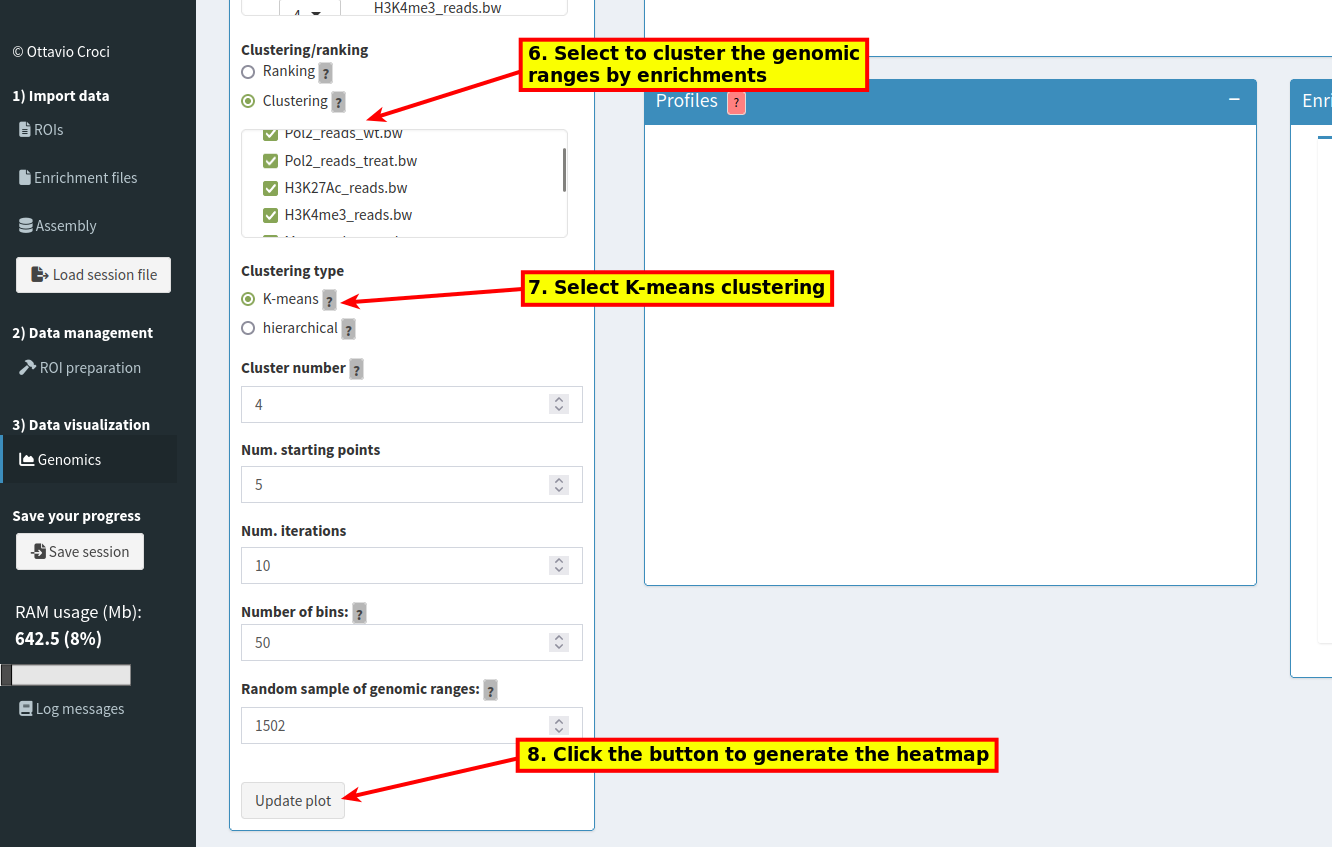
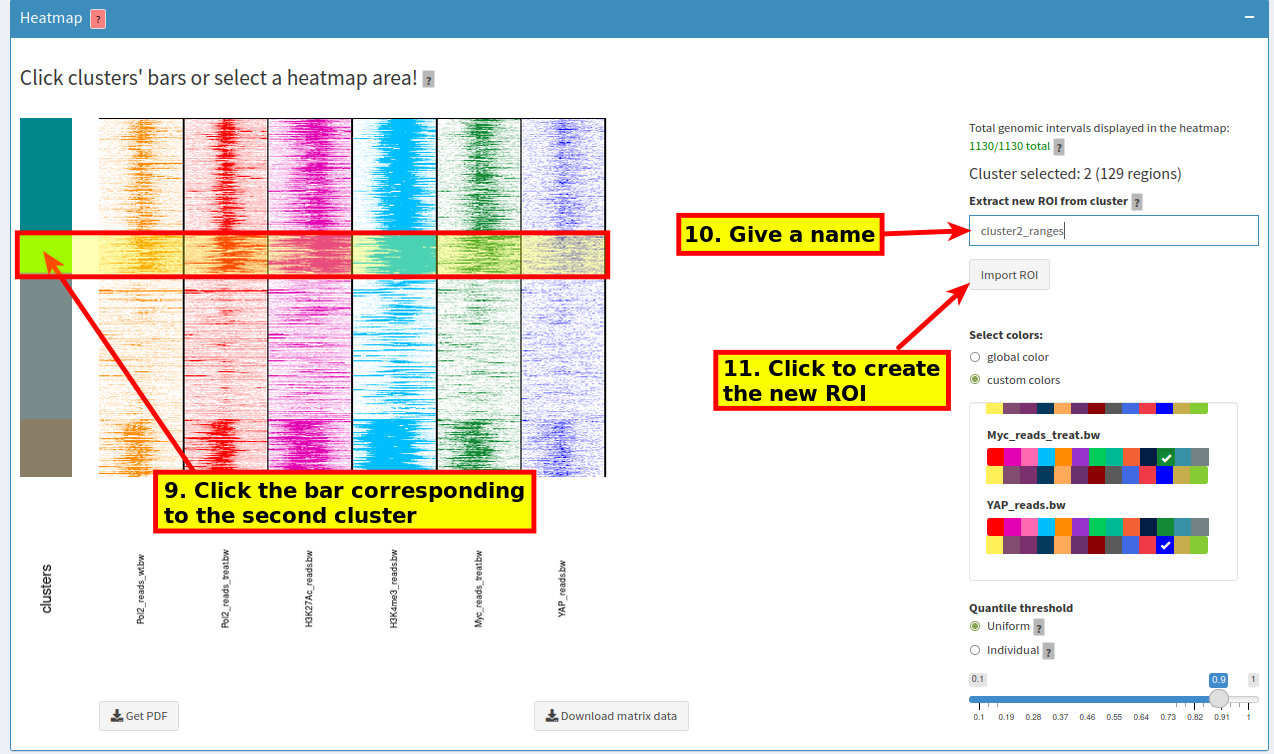
Then, play interactively with the heatmap by clicking clusters for particular enrichment patterns.
You can extract ROIs from a specific cluster:
Option 1: With the example data
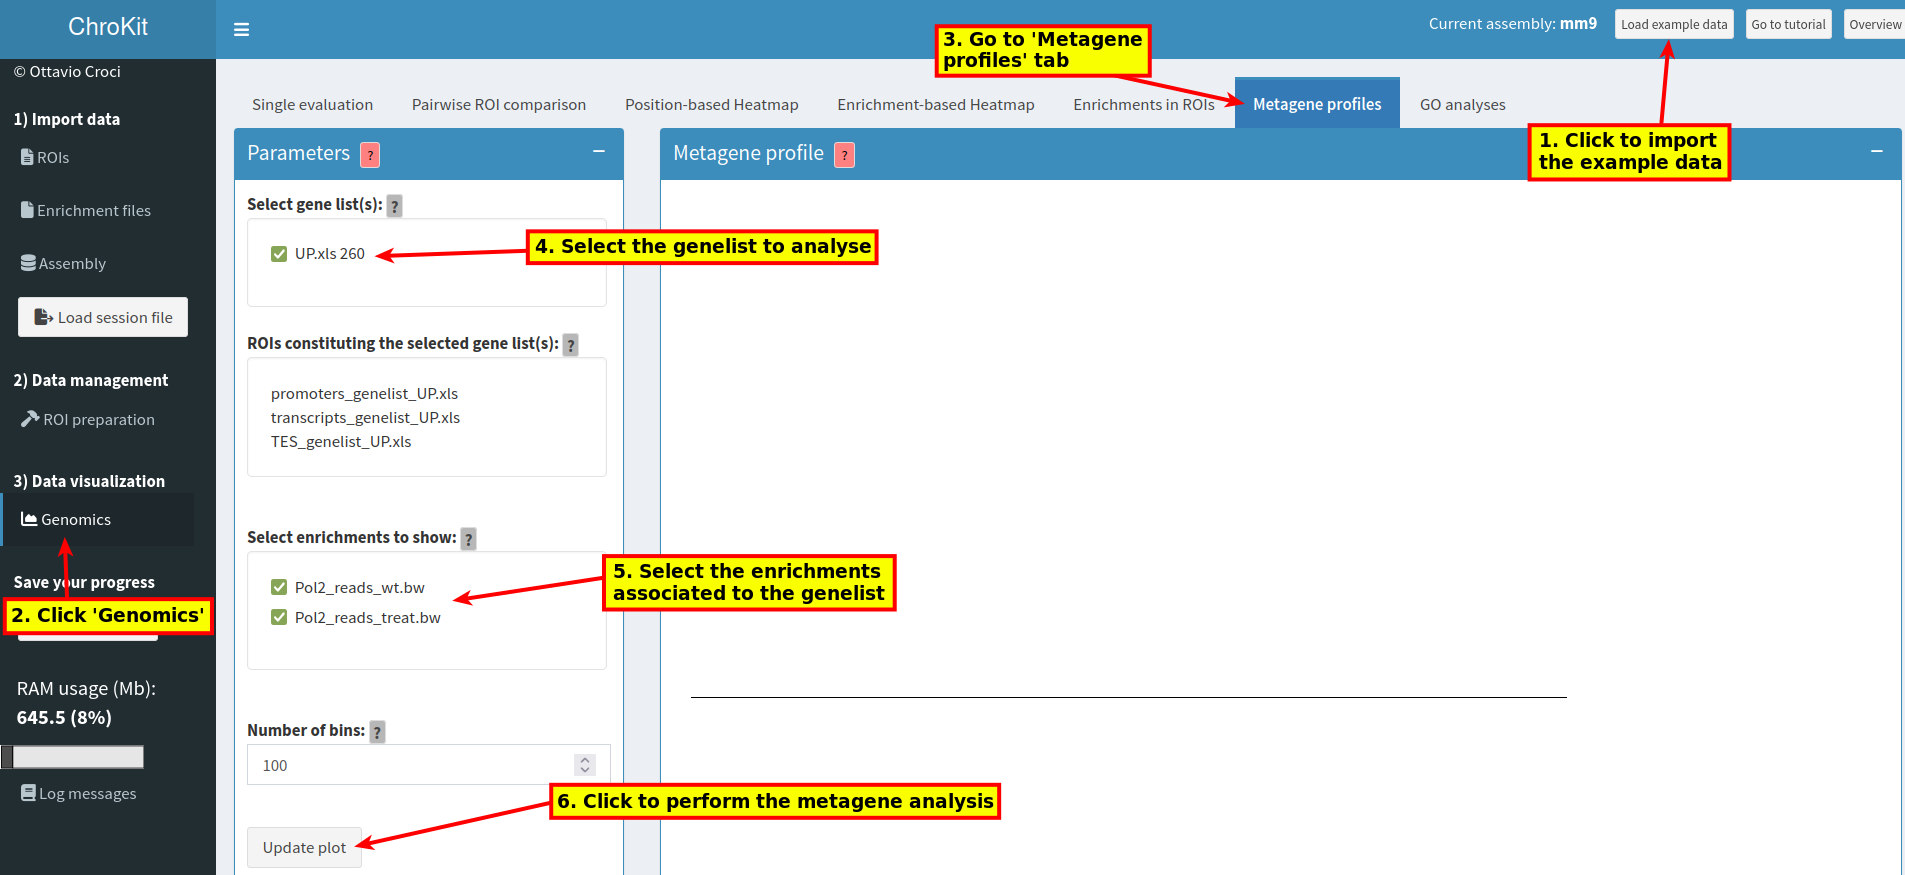
Load the example data (1), click 'Genomics' (2) and follow the steps.
Option 2: With your own data
Alternatively, if you have your own gene lists and enrichments, start from step 2 and select the gene lists and enrichments that you want to analyze (step 4, 5):
Then, visualize the results and play with graphical options:
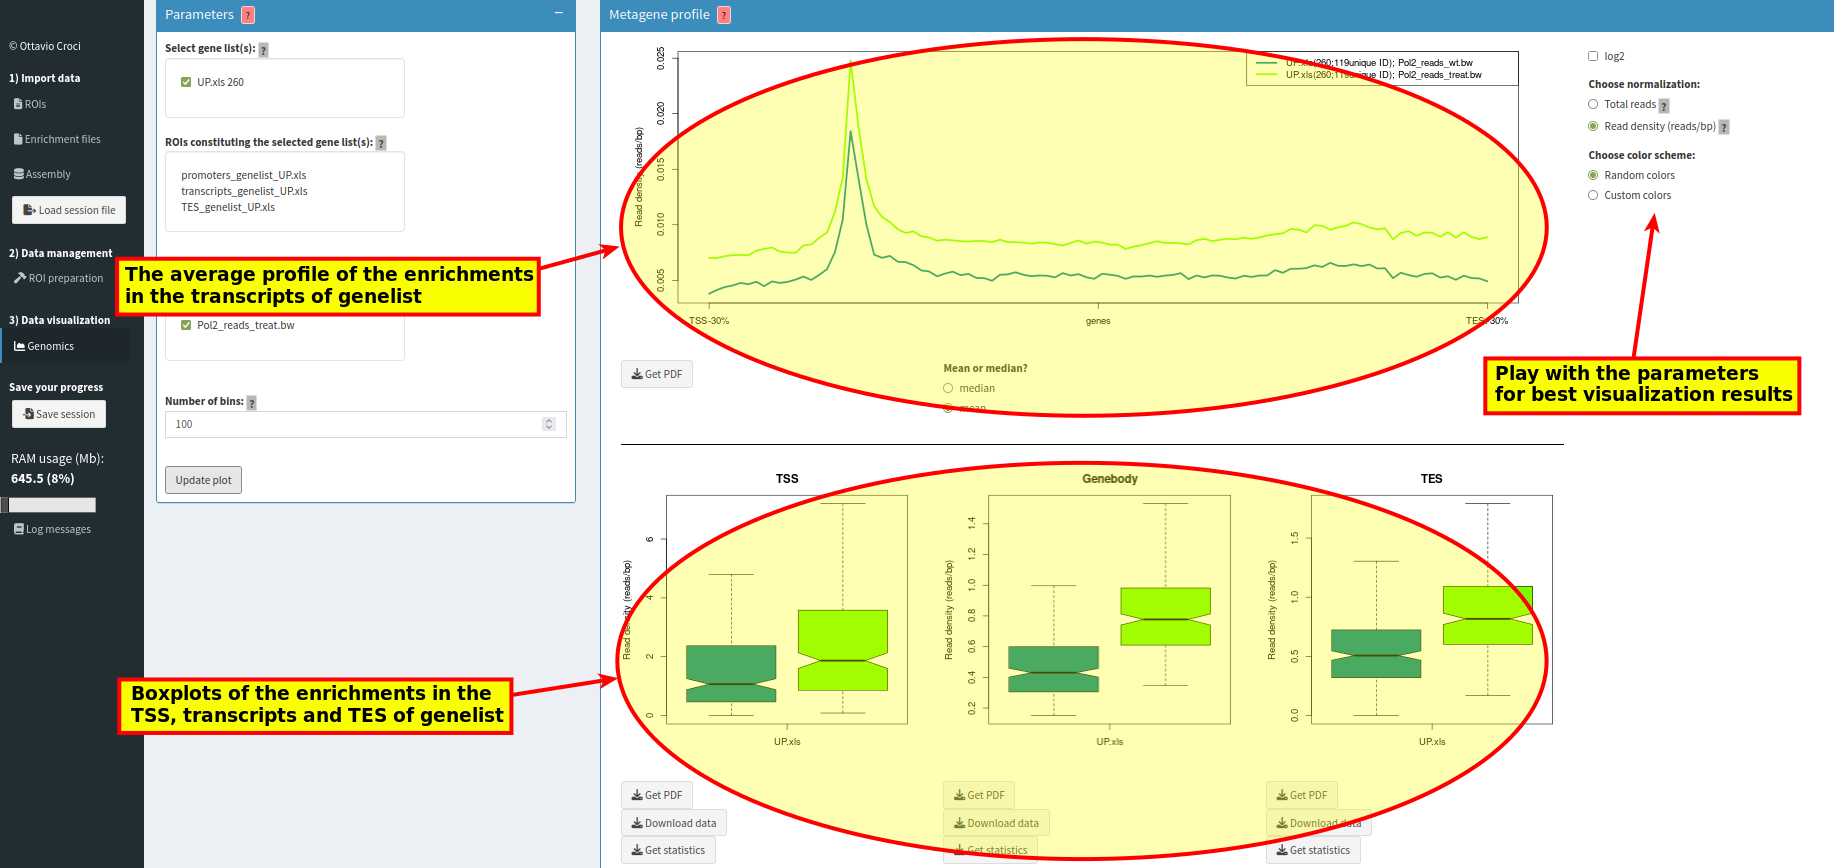
Scroll down for further output boxes: